
Rising yields have made the near-term environment more challenging for bonds, but they have also improved the outlook for future returns.
Executive Summary
- U.S. debt remains on a challenging long-term path, but stronger economic growth could help ease some of the pressure.
- Higher rates are likely to create a gradual drag on households and companies, with smaller companies generally more exposed than their larger peers.
- The U.S. Treasury and the Fed retain tools that could help limit disorderly moves in rates markets.
- For portfolios, higher yields have improved the long-term outlook for fixed income, while resilient growth and corporate earnings continue to support a near-term preference for equities.
In this Issue


Debt levels have been climbing globally for years across governments, companies, and households. The U.S. is no exception, with federal debt increasing under both Republican and Democratic presidents and Congresses over the past two decades. The drivers have varied, from tax cuts and wars to financial crises and pandemic relief, but the direction has remained the same. Whoever takes control after November’s midterm elections will inherit a fiscal position that took decades, and administrations from both parties, to build.
At the same time, borrowing costs have risen this year for governments, consumers, and corporate borrowers alike, bringing the implications of greater debt increasingly into focus.
Against this backdrop, in this Quarterly Investment Perspective, we examine the U.S. fiscal backdrop and outlook, policymakers’ evolving toolkit under Fed Chair Kevin Warsh and Treasury Secretary Scott Bessent, the state of the consumer and corporate balance sheets, and how Bessemer is positioning for an environment of higher borrowing costs (Exhibit 1).
Exhibit 1: 10-Year Government Bond Yields
Key takeaway: The rise in bond yields has been global, reflecting a combination of stronger growth and fiscal pressures.
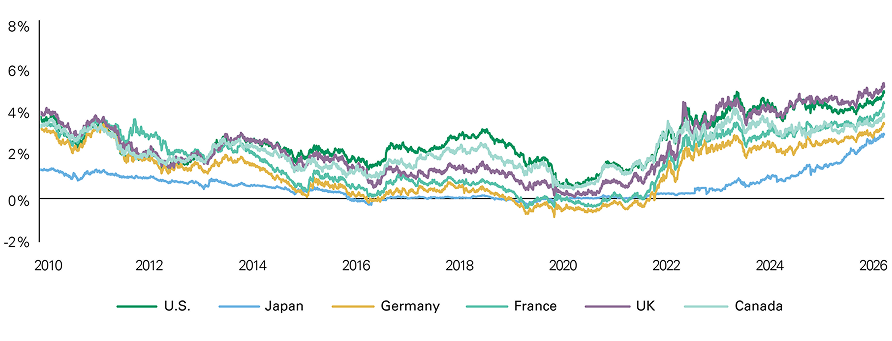
Line chart comparing percentage trends for the United States, Japan, Germany, France, the United Kingdom, and Canada from 2010 to 2026. Values generally decline through the 2010s, with several countries reaching zero or negative levels between 2016 and 2021. All six rise sharply beginning around 2022. The United Kingdom and United States finish highest, at approximately 5%, while Japan finishes lowest, near 3%. France, Canada, and Germany finish between these levels. Japan remains below the other countries for most of the period.
As of September 17, 2026. Source: Macrobond

Concerns over the U.S. fiscal trajectory persist as large primary deficits and rising interest expense, which now exceeds defense spending, push debt-to-GDP to 100%, consistent with its post-World War II peak. Higher bond yields and elevated inflation have only amplified those concerns. The economic implications are meaningful: sustained debt growth can contribute to higher borrowing costs, crowd out private investment, and increase inflationary pressures if accompanied by debt monetization. In more extreme scenarios, deteriorating confidence in a country’s fiscal position can contribute to capital flight and currency depreciation.
The long-term U.S. debt trajectory is unsustainable without some combination of stronger growth or fiscal adjustment. Deficits are projected to remain above 4% of GDP for the foreseeable future, unusually large for an economy at full employment, and more typical of levels seen during periods of economic stress. The Congressional Budget Office (CBO) projects that these deficits will help push debt-to-GDP to 120% by 2036. Through August, the FY2026 deficit is tracking at 6.5% of GDP, compared with 5.3% in FY2025, with the year-to-date budget shortfall reaching $1.97 trillion. Roughly 3 percentage points of the deficit relative to GDP reflect the primary deficit, as outlays have risen to nearly 23% of GDP while revenues have remained relatively stable at 17%–18%. Interest costs account for much of the remainder: interest expense has climbed to nearly 3% of GDP and 15% of federal outlays, levels not seen since the 1990s, driven by higher rates.
Absent policy changes, particularly to entitlement programs, large primary deficits are likely to persist, keeping debt-to-GDP on an upward path (Exhibit 2). Stabilizing the ratio would require primary deficits closer to 0%–1% of GDP, a meaningful reduction from current levels. Tariff revenue (assuming an average effective rate near 10%–11%) and One Big Beautiful Bill Act (OBBBA) offsets should help narrow the FY2027 deficit modestly but are unlikely, on their own, to alter the longer-run trajectory. Pandemic-era expansions to Medicaid and food-stamp eligibility, combined with the absence of automatic fiscal feedback rules and the autopilot nature of entitlement spending, add further pressure.
Exhibit 2: The U.S. Debt-to-GDP Trajectory
Key takeaway: Comparing the U.S. debt trajectory to estimates of unsustainability, as well as historical highs in other countries, suggests that the U.S. is decades away from so-called tipping points.
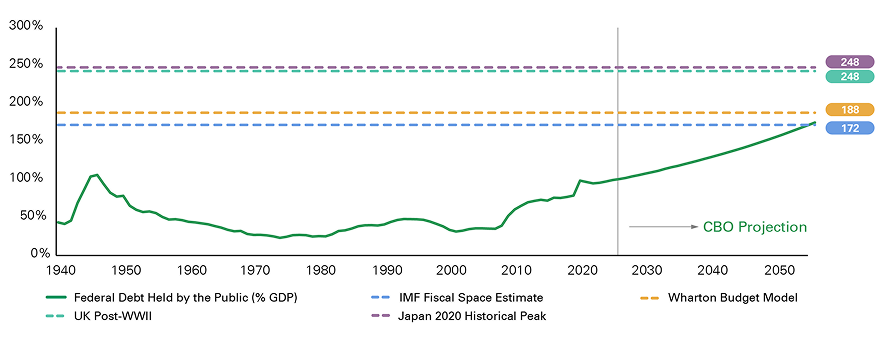
Line chart showing U.S. federal debt held by the public as a percentage of gross domestic product from 1940 through the mid-2050s. Debt rises to roughly 100% in the mid-1940s, declines to around 20% in the 1970s, and then increases to approximately 100% by the mid-2020s. Beyond a vertical divider, the Congressional Budget Office projection rises steadily toward 170% by the mid-2050s. Horizontal dashed comparison lines are labeled 172% for the International Monetary Fund fiscal space estimate, 188% for the Wharton Budget Model, and 248% for both the United Kingdom’s post-World War II level and Japan’s 2020 historical peak.
As of February 11, 2026. Source: Macrobond
Interest expense itself is on a rising path. Even assuming an optimistic 3% nominal rate on new issuance, interest costs are projected to reach roughly 4% of GDP by the 2030s. The pace of that increase hinges on how sensitive rates are to a growing debt stock, a sensitivity that has declined in recent decades but is likely to be higher going forward. Research suggests that each 1-percentage-point rise in debt-to-GDP adds 3–4 basis points to long-term yields.
The outlook becomes more favorable once growth, a key mitigating factor, is taken into account (Exhibit 3). Debt sustainability depends importantly on the relationship between the average interest rate on public debt (r) and the economy’s growth rate (g): when growth exceeds the interest rate, debt-to-GDP can stabilize or decline without requiring primary surpluses.
Exhibit 3: Nominal U.S. GDP Growth and the Interest Cost of Public Debt
Key takeaway: Economic growth is likely to continue to outpace rising interest costs, a key condition for debt sustainability.
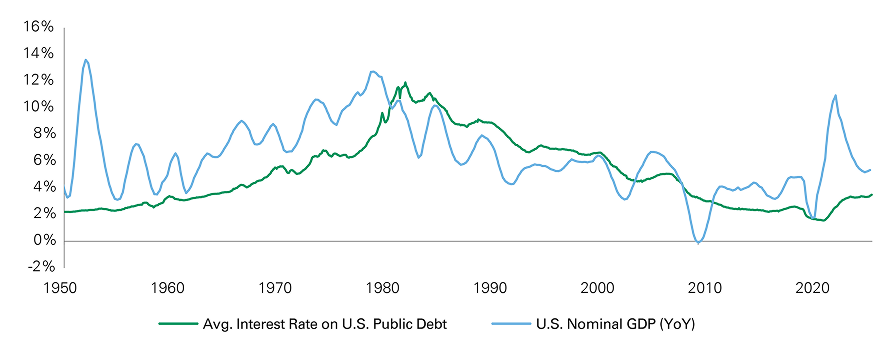
Line chart comparing the average interest rate on U.S. public debt with year-over-year U.S. nominal gross domestic product growth from 1950 through the mid-2020s. GDP growth fluctuates more sharply than the average debt interest rate. The debt interest rate rises from approximately 2% in 1950 to nearly 12% in the early 1980s, then declines to around 1.5% in 2020–2021 before increasing again. GDP growth briefly falls below zero around 2009 and exceeds 10% around 2022. At the end of the period, nominal GDP growth is approximately 5%, above the average debt interest rate of roughly 3.5%.
As of August 31, 2026. Source: Macrobond
That condition looks achievable given the current AI-driven capex cycle and accelerating productivity trends. Official growth assumptions remain conservative (2.1% for 2026–2027 and 1.8%–2.0% in the long run in real terms) and may understate AI’s productivity impact. Labor productivity growth has already accelerated to 2.5%, well above the pre-pandemic average of roughly 1%, leading some researchers to argue the economy has entered a higher-productivity regime. Nominal GDP is already growing above 6% year over year, compared with the Congressional Budget Office’s sub-5% decade-ahead forecast, which embeds just a 10-basis-point AI productivity boost.
Studies incorporating a more meaningful 50–100-basis-point boost (Yale Budget Lab, Elmendorf & Dylan) show debt-to-GDP settling at 110%–115% by 2036, with one analysis (Harris, Mehrotra & Overcash) projecting overall deficits narrowing to 1%-2% of GDP — a level broadly consistent with a falling debt-to-GDP ratio. That said, offsetting impacts from AI are possible, including a higher neutral rate (rising interest costs), increased longevity (higher healthcare costs), and lower labor force participation (lower growth and revenue).
Policy solutions exist, even if they may be politically difficult to enact. Deficits are a choice, and the U.S. has room to move on both sides of the ledger: revenue as a share of GDP remains below that of G7 peers, while spending sits at historically elevated levels. Bipartisan proposals have emerged, such as the Moreno-Warren plan to raise the Social Security payroll tax cap. Voter concern over deficits is rising, though it still trails other issues, such as inflation and healthcare affordability. Historical precedent for meaningful fiscal correction exists, notably after World War II and in the 1990s, and the next presidential cycle (2028–2032) is a probable window for serious policy action.
The key catalyst? The Social Security trust fund is now projected to deplete by late 2032, a quarter earlier than last year’s estimate, triggering an automatic 22% cut to payable benefits. The insolvency date now falls within the next presidential term as well as the tenure of senators elected in 2026, raising the political stakes and potentially accelerating the timeline for action.
Despite an untenable long-run trajectory, current debt levels do not point to imminent risk of dollar debasement. The theoretical “tipping point,” where investor confidence in government financing erodes sharply enough to trigger a self-reinforcing spike in yields and dollar decline, is highly uncertain. Existing estimates place it decades away, if it is reached at all. Two frameworks (shown in Exhibit 2) put the debt-to-GDP threshold at 172%–188%, a level unlikely to be reached before 2050. Importantly, the U.S. also retains structural advantages that many sovereign borrowers lack: reserve-currency “exorbitant privilege,” the deepest and most liquid government bond market in the world, a freely floating exchange rate, and one of the strongest growth profiles among developed economies. These factors have important implications for the resiliency of demand for U.S. Treasuries, particularly as many economies are still running trade surpluses and will continue accumulating dollars.
For investors, the more relevant risk is not a debt crisis but a repricing in rates markets in an era of fiscal dominance. If the debt trajectory continues unchecked, the term premium could rise from its current level of just under 1% — roughly in line with historical averages but still well below levels seen in the 1990s — making duration positioning and interest rate volatility, rather than a dollar collapse, the more actionable risk to monitor over the coming cycle.

The rising U.S. debt trajectory comes at a time when the Federal Reserve has stepped back from balance sheet expansion and foreign official demand has softened, shifting the marginal buyer base toward more price-sensitive investors and complicating Treasury issuance. With $6.4 trillion of debt outstanding at maturities of
nine years or longer, that could put upward pressure on longer-term yields through greater sensitivity to debt supply, a rising term premium, and lower convenience yields (or the extra value investors get from holding Treasuries due to their safety and liquidity).
That said, longer-dated debt represents only about 20% of total U.S. debt outstanding, a modest share compared with G7 peers, and Treasury has several ways to manage this exposure. Issuance is already tilting toward bills, which now account for 22% of the total, up from 15% a few years ago. Upcoming refunding announcements could also bring smaller long-end auction sizes or even the retirement of the 20-year bond. Treasury also has signaled larger buybacks funded via T-bills or its cash balance (the Treasury General Account, or TGA), while looming bank deregulation — expected with the finalization of Basel III capital rules, including global systemically important bank (GSIB) reform, this year — could free up balance sheet capacity for Treasury purchases by easing reserve requirements.
Demand dynamics are also more constructive than the headline risks suggest. The size of the Fed’s balance sheet, while lower following quantitative tightening, has stabilized (Exhibit 4). While the reduction in the Fed’s balance sheet and Chair Warsh’s task force on the subject have elicited many headlines, the economic implications of any changes to the balance sheet are not likely to be impactful. The Treasury can adjust the maturity of issuance to better manage market dynamics, while the Fed will set interest rates to achieve its employment and inflation goals. Both of these items will happen regardless of the size of the Fed’s balance sheet.
Exhibit 4: G4 Central Bank Balance Sheets (% of GDP)
Key takeaway: Central bank demand has declined in recent years, pointing to a more price-sensitive marginal buyer of U.S. Treasuries going forward.
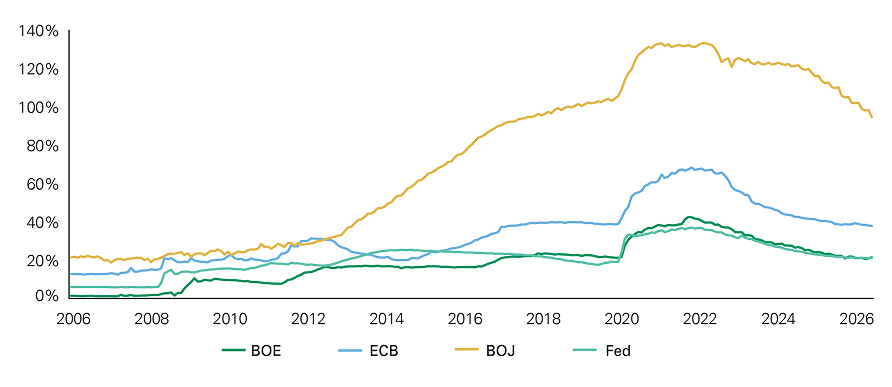
Line chart comparing percentage series for the Bank of England, European Central Bank, Bank of Japan, and U.S. Federal Reserve from 2006 to 2026. The Bank of Japan has the highest values for most of the period, rising from approximately 20% to a peak near 135% around 2021–2022 before declining to about 95%. The European Central Bank peaks near 70% around 2022 and finishes near 38%. The Bank of England and Federal Reserve rise sharply in 2020, reach peaks of roughly 42% and 37%, respectively, and finish near 22%. All four decline from their early-2020s peaks.
As of June 30, 2026. Source: Bloomberg
Furthermore, disorderly increases in yields can easily prompt the resumption of central bank purchases. This occurred when repo rates spiked in September 2019 and in a “dash for cash” at the onset of COVID. Foreign official demand, while down from prior peaks, remains above levels seen before the global financial crisis, and foreign private investors have filled the gap (Exhibit 5). Emerging demand from stablecoin issuers’ T-bill holdings adds a further source of support.
Exhibit 5: Foreign Demand of U.S. Treasuries
Key takeaway: Foreign official sector demand has softened, but private demand has continued to increase.
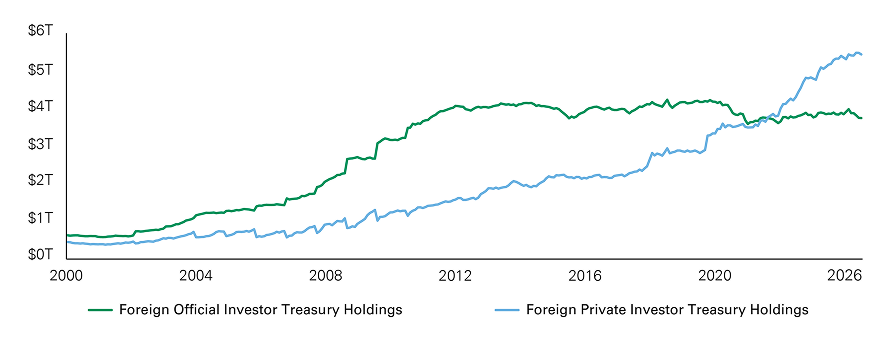
Line chart comparing foreign official and foreign private investor holdings of U.S. Treasury securities from 2000 to 2026, measured in trillions of dollars. Official holdings increase from approximately $0.5 trillion in 2000 to $4 trillion by 2012, then fluctuate mostly between $3.5 trillion and $4.2 trillion. Private holdings grow from roughly $0.3 trillion to about $2 trillion by the mid-2010s, then rise more rapidly after 2018. Private holdings overtake official holdings around 2022 and continue increasing. At the end of the period, private holdings total approximately $5.4 trillion, compared with $3.7 trillion in official holdings.
As of July 31, 2026. Source: Bloomberg
Fed policy also plays a critical role in shaping the path of interest costs. Rate-hiking cycles typically raise short-term borrowing costs more than long-term yields, flattening the yield curve, while yields tend not to peak until the end of the cycle. This leaves Treasury more exposed to near-term rate moves given its pivot toward bill issuance, though it can narrow the “r minus g” gap that underpins debt sustainability.
We don’t view the current cycle, which included a 25-basis-point rate increase in September, as a meaningful threat to the interest-cost outlook, for several reasons.
First, we expect the cycle to be shallow, as inflationary pressures are concentrated in select pockets rather than broad-based, while disinflationary forces in unit labor costs, productivity, and shelter prices continue to provide an offset.
Second, further rate increases would likely coincide with stronger underlying growth momentum, the latter which itself supports the “r minus g” dynamic discussed above.
Third, holding rates too low for too long could pose a greater long-term risk to sustainability. A building of inflation pressures could eventually force the Fed toward a more aggressive tightening cycle, with potentially worse labor market impacts. Several FOMC participants have recently cited this risk in arguing for earlier, and more modest, rate increases.
Finally, policymakers retain meaningful flexibility to manage this risk. Treasury can adjust the composition of its issuance, as discussed above, while the Fed can independently manage the size of its balance sheet.
Taken together, while the fiscal backdrop warrants continued vigilance, the combination of Treasury’s flexibility and signaling, Fed policy and pursuit of its dual mandate, incremental regulatory relief, and resilient private demand suggests that a material or disorderly move higher in long-term yields is not inevitable.

The recent increase in interest rates across the Treasury yield curve represents a growing headwind for U.S. households. The rise has been particularly pronounced for longer-dated maturities, with important implications for how higher rates are transmitted to consumers. Year-to-date through September 24, 5-year and 10-year Treasury yields have increased by 1.28% and 0.97%, respectively.
At the short end of the curve, the aggregate household balance sheet holds considerably more interest-rate- sensitive assets than liabilities (Exhibit 6). Households have approximately $20.3 trillion in deposits and money market funds, compared to $1.3 trillion in credit card debt and $450 billion in home equity line of credit (HELOC) balances. However, the distribution of those assets and liabilities matters. Empirical evidence shows that higher short-term rates tend to simultaneously increase household interest income and constrain consumption. While the increase in income from rising money market yields and deposit rates should more than offset higher credit card interest payments, interest income tends to accrue disproportionately to wealthier households, which generally have a lower propensity to spend incremental income. Higher credit card costs, by contrast, fall more heavily on households that rely on revolving credit and are more likely to reduce spending as financing costs rise. Recent Boston Fed research found that a 1-percentage- point increase in credit card APRs was associated with an 8.7% decline in credit card spending in the following month. While credit card spending represents only one component of household consumption, the findings illustrate how higher borrowing costs can weigh on spending even when household assets exceed liabilities in aggregate.
Exhibit 6: Household Direct Interest-Rate-Sensitive Assets and Liabilities
Key takeaway: U.S. households’ rate-sensitive assets and liabilities are distributed unevenly across maturities.
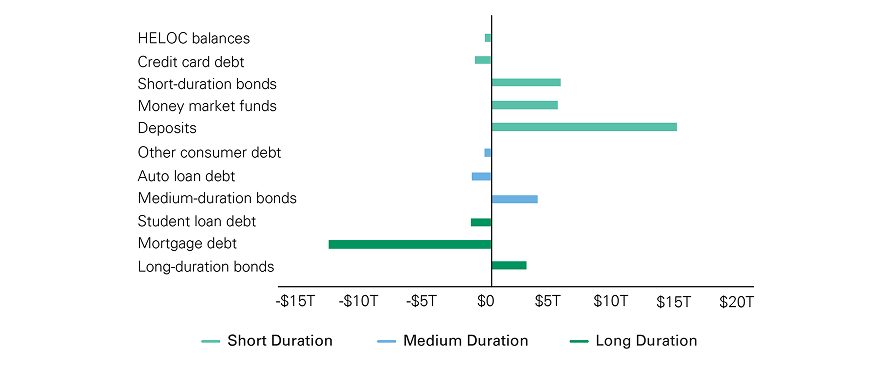
Horizontal bar chart showing selected financial assets to the right of zero and debts to the left, measured in trillions of dollars and grouped by duration. Short-duration assets include deposits of approximately $15 trillion, short-duration bonds of $5.5 trillion, and money market funds of $5 trillion. Short-duration debts include credit card debt of about $1.3 trillion and home equity lines of credit of $0.5 trillion. Medium-duration categories include bonds of roughly $4 trillion, auto loan debt of $1.5 trillion, and other consumer debt of $0.5 trillion. Long-duration categories include bonds of approximately $3 trillion, student loan debt of $1.5 trillion, and mortgage debt of $13 trillion. Deposits and mortgage debt are the largest opposing balances.
As of August 31, 2026. Source: Federal Reserve, Federal Reserve Bank of New York, data.gov
Percentage of household bond holdings allocated to short duration, medium duration, and long duration were estimated using maturity breakdown from the U.S. Treasury Monthly Statement of the Public Debt (MSPD). Household assets and liabilities listed do not include non-direct interest-rate-sensitive assets and liabilities, such as equities and real estate.
Percentage of household bond holdings allocated to short duration, medium duration, and long duration were estimated using maturity breakdown from the U.S. Treasury Monthly Statement of the Public Debt (MSPD). Household assets and liabilities listed do not include non-direct interest-rate-sensitive assets and liabilities, such as equities and real estate.
The intermediate portion of the yield curve primarily affects auto loans and other financed durable purchases. Households currently hold about $1.7 trillion of auto debt, although most outstanding auto loans carry fixed rates. This means higher yields do not immediately result in higher payments on the entire balance but become relevant as households finance new vehicles. Auto loan delinquencies recently reached 5.5%, above the 2008-09 financial-crisis peak of 5.3%, suggesting that some buyers have limited capacity to absorb higher financing costs. On the asset side, rising yields result in mark-to-market losses on existing bond holdings, while the benefit from reinvesting at higher yields arrives more gradually. Taken together, these dynamics are likely to weigh on consumption.
At the long end of the curve, roughly 70% of U.S. household debt consists of mortgages, overwhelmingly 30-year fixed-rate loans with a large portion originated at rates well below those prevailing today. Payments for most existing borrowers are therefore unlikely to change. The effects of long-term rates may instead be felt on the asset side. Long-duration bonds are particularly sensitive to rising rates, and higher rates can also weigh on both equity and home valuations. Federal Reserve research has estimated a marginal propensity to consume 3 cents for every dollar change in wealth, suggesting a modest direct effect on spending from valuation changes. The behavioral effect is likely to be more meaningful. Mortgage rate lock-in discourages existing homeowners from moving, reducing housing turnover, and, in turn, demand for durable goods and home improvement spending.
Taken together, the broader economic implication is more consistent with a gradual drag on growth than an abrupt consumer retrenchment. If the recent increase in yields persists, the cumulative effect could increasingly appear in slower housing turnover, lower durable goods spending, and greater dispersion between asset-rich and credit-dependent consumers. That uneven transmission helps explain why consumer data can remain resilient in aggregate even as higher interest rates become an increasingly meaningful constraint on the most rate-sensitive parts of the economy.

Near-Term Implications
Corporate debt maturity schedules imply that the near-term impact of higher debt costs should be limited, particularly for large-cap issuers. The median S&P 500 company has a weighted average debt maturity of 6.6 years, while the shortest decile has an average maturity of 3.3 years. Small-cap companies are more impacted: the median company’s weighted-average debt maturity is around 3.8 years; for the shortest-decile issuer, the figure is less than 2 years, implying the need to address refinancings in the next year.
Small-cap companies are also more sensitive to interest rates than their large-cap counterparts, as they issue floating-rate debt more often. Most floating-rate corporate debt is based on the Secured Overnight Financing Rate (SOFR), which tracks the federal funds rate, exposing these companies to rate-hiking cycles.
Large companies also appear well-positioned, in aggregate, to absorb some increase in financing costs. As seen in Exhibit 7, the median S&P 500 company’s interest coverage ratio, which measures operating earnings relative to interest expense, today is 7x, in line with levels over the past 20 years. Even the lowest-decile company has a positive ratio, implying that operating earnings are sufficient to service debt, with some cushion to absorb higher costs.
Exhibit 7: Median Interest Coverage Ratio: Large-Cap and Small-Cap Companies
Key takeaway: Interest coverage ratios remain healthy among large-cap issuers, but have trended down among smaller ones.
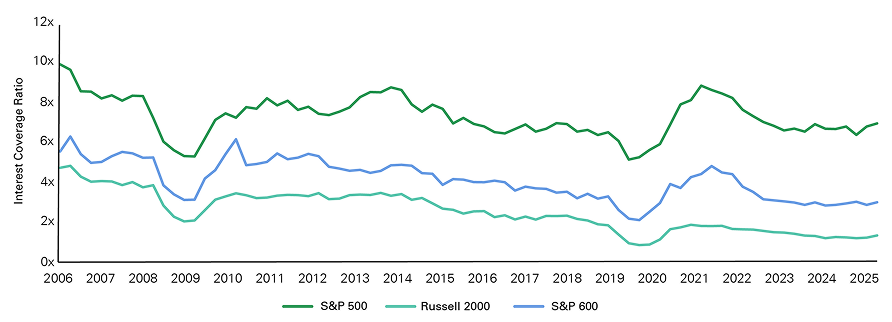
Line chart comparing interest coverage ratios for the S&P 500, S&P 600, and Russell 2000 from 2006 to 2025. The S&P 500 has the highest ratio throughout, followed by the S&P 600 and Russell 2000. All three decline sharply around 2008–2009 and again around 2020, recover in 2021, and subsequently decline. Around the 2020 low, the Russell 2000 falls below 1 time, while the S&P 600 reaches approximately 2 times and the S&P 500 reaches about 5 times. By the end of the period, ratios are approximately 7 times for the S&P 500, 3 times for the S&P 600, and 1.3 times for the Russell 2000.
As of September 14, 2026. Source: Bloomberg
The small-cap universe is more vulnerable, with 15% or more of constituents having negative interest coverage. Differences in fundamentals come to the fore when examining debt burdens. Among small companies with positive earnings, the median company has more than twice the interest coverage ratio of the broader small-cap universe.Footnote * To the extent that financing costs remain elevated over a longer period, we believe the quality distinction will become increasingly important.
Longer-Term Dynamics
Over the longer term, yield levels will be driven by evolving demand for capital. The global economy may be entering a new secular regime in which increasing focus on capex-intensive physical investment will enhance demand for capital. The confluence of AI-driven technological change and elevated geopolitical volatility has created an environment of increasing scarcities. Many of these — from accelerating demand for hardware and semiconductors, to greater need for energy production as aging grids meet growing demand, to supply-chain reorientation for resilience — are physical scarcities, which are more resource- and capital-intensive than the digital scarcities of the software cycle. This is likely to drive increased capital expenditure, with hyperscalers’ capex the most prominent, but not the only, example.
To the extent that this dynamic leads capital demand to grow faster than capital supply, the cost of capital should remain elevated relative to the last cycle. This can have several implications for corporate issuers and investment opportunities. A higher cost of capital puts increasing focus on operating cash flow generation, profitability, and earnings quality. It also raises the return hurdle for investment, elevating the importance of disciplined capital deployment.
Capital allocation decisions may evolve over time as well, as companies weigh reinvestment against shareholder distributions. Over the past four years, a greater percentage of operating cash flows has gone toward capex, while the share used for buybacks has moderated. Although share buybacks have added meaningfully to stock returns, a moderation is not necessarily a negative sign. For companies with disciplined management teams, it may instead signal a greater number of value-accretive investment opportunities.
For investors, the opportunity set may broaden, reversing a trend seen in the prior cycle. With scarcity increasingly moving to physical, rather than digital, assets, value can accrue to a variety of themes across infrastructure and industrial capacity. A broader, more diversified opportunity set presents a more stable and constructive market backdrop than one of greater concentration, in our view. On the other hand, if growing capital demand meets supply scarcity, some value-added initiatives may get crowded out in favor of higher-growth opportunities. This may skew capital formation toward growth sectors.
Corporations may also increasingly streamline the scope of operations, divesting nonstrategic assets to finance strategic initiatives. Some of these assets may find a home in private equity, where skilled specialists can maximize value.

Rising bond yields have created a challenging environment for fixed income returns so far in 2026, with many global government bond markets posting negative returns.
Credit markets have been more resilient, particularly higher-yielding corporate issuers, supported by solid economic growth and healthy corporate fundamentals.
Against this backdrop, our fixed income portfolios have generally performed in line with their benchmarks. Our preference for longer-duration bonds has detracted from relative performance as yields have risen, while credit exposure and security selection have contributed positively. At the same time, higher yields have provided opportunities to incrementally add duration at increasingly attractive levels, improving the return potential of portfolios going forward.
Many of the forces that pushed yields higher are likely to persist through the end of the year. Economic growth remains strong, inflation is above target, geopolitical uncertainty is elevated, and concerns surrounding the U.S. fiscal outlook continue to put upward pressure on longer-term rates. Significant spending on artificial intelligence and data center infrastructure could also lead large technology companies to issue more debt to fund their investment plans, adding to overall supply.
However, much of this appears to be priced into the market with the latest rise in yields, as investors are already anticipating a fairly aggressive path on monetary policy. Current expectations for Federal Reserve policy are for three or four additional rate hikes before the end of 2027. Inflation, while above the Fed’s target, is not meaningfully so, and we expect transitory effects from tariffs, energy, and AI-induced price increases to roll off by the middle of next year. That, combined with Fed Chair Warsh’s preference for less explicit forward guidance, could mean more volatility in interest rate path expectations than is typical. Near-term moves in yields may also reflect headlines and short-term trading positioning as much as underlying fundamentals. We believe current bond yields largely reflect strong economic growth, fiscal concerns, and expectations for continued inflation and Fed tightening.
All else equal, higher interest rates and bond yields tend to put downward pressure on equity valuations. So far this year, however, strong corporate fundamentals have allowed equities to overcome that headwind and generate positive returns. Valuation multiples have indeed moderated recently, but this is at least in part due to strong earnings growth expanding the earnings denominator. Earnings are anticipated to be strong through this year and next, supported by AI-related capital spending and a resilient consumer, providing a fundamental floor on prices even if multiples slightly decline amid rate hikes.
The magnitude of the impact on equities tends to depend on the pace and duration of the hiking cycle, as well as the reasons for it. Prolonged and aggressive tightening, such as what was experienced in 2022, can meaningfully weigh on equities as discount rates and financing costs rise quickly and growth concerns emerge. By contrast, we expect this cycle to be more limited in both magnitude and duration, which should translate into a more modest impact on equities. Historically, the first rate hike in a cycle is associated with a negative impact on multiples, but equity markets are typically higher within a few months of the first move. Importantly, part of the rationale behind this move in bond yields and the fed funds rate is strong economic growth and a healthy labor market, both of which are positive signs for equities.
While the near-term environment may remain challenging for bonds, the rise in yields is creating a much more compelling environment for fixed income over a longer horizon. The adjustment from abnormally low rates to today’s more normal yield levels has resulted in limited returns from fixed income over the past several years, but higher yields provide a considerably better starting point for future returns. Higher starting yields mean greater income for investors while also providing a larger cushion against potential price declines if rates move modestly higher from here (Exhibit 8).
Exhibit 8: Starting Bond Yields and Forward Returns
Key takeaway: A good indicator of future fixed income returns is the starting yield. While the past few years have been painful, forward-looking returns for fixed income are more favorable.
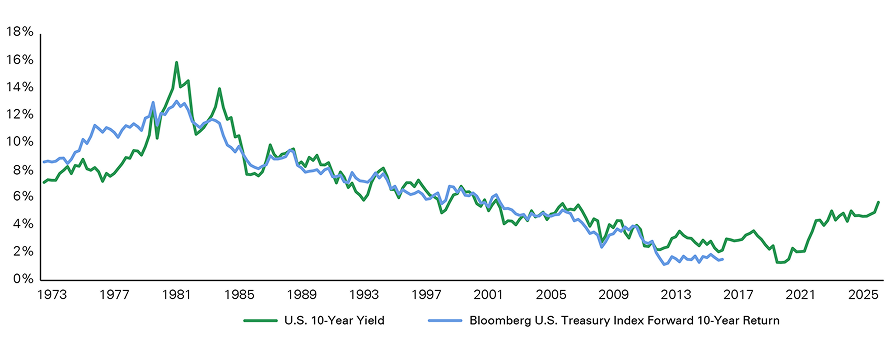
Line chart comparing the U.S. 10-year Treasury yield with the Bloomberg U.S. Treasury Index’s forward 10-year return. The yield series runs from 1973 through the mid-2020s, while the forward-return series ends around 2016. Both rise into the early 1980s and then generally decline over several decades. The Treasury yield peaks near 16% around 1981, while the forward return peaks around 13% in the early 1980s. Forward returns fall to approximately 1%–2% in the early to mid-2010s. The Treasury yield reaches roughly 1% around 2020 before rising to about 5.5% at the end of the chart. The two series broadly track one another during their overlapping years.
As of September 29, 2026. Source: Bloomberg, Bessemer Trust
Just as importantly, bonds may be better positioned to provide meaningful diversification during periods of economic or equity market weakness. If concerns around economic growth eventually materialize and yields fall, bonds could benefit from both today’s higher income and moderate price appreciation as interest rates fall.
This improving outlook for bonds has implications for portfolio construction. Over the last 15 years, historically low bond yields made a structural preference for equities relatively straightforward. As bond yields normalize, the risk-return tradeoff between stocks and bonds is becoming more balanced over the long term. In the near term, however, we continue to favor equities over fixed income due to the combination of resilient growth and healthy corporate earnings.
Higher borrowing costs are likely to remain an important component of the overall investment landscape, with implications across markets, consumers, companies, and governments. But higher rates do not affect constituents equally. Strong economic growth, healthy corporate fundamentals, and policy flexibility should help the economy adjust, even as more leveraged and rate-sensitive areas face greater pressure.
The current backdrop reinforces the importance of selectivity, balance-sheet strength, and disciplined portfolio construction. We believe portfolios that remain diversified and focused on long-term fundamentals are well positioned to navigate this evolving environment.
Past performance is no guarantee of future results. This material is provided for your general information. It does not take into account the particular investment objectives, financial situations, or needs of individual clients. This material has been prepared based on information that Bessemer Trust believes to be reliable, but Bessemer makes no representation or warranty with respect to the accuracy or completeness of such information. This presentation does not include a complete description of any portfolio mentioned herein and is not an offer to sell any securities. Investors should carefully consider the investment objectives, risks, charges, and expenses of each fund or portfolio before investing. Views expressed herein are current only as of the date indicated, and are subject to change without notice. Forecasts may not be realized due to a variety of factors, including changes in economic growth, corporate profitability, geopolitical conditions, and inflation. The mention of a particular security is not intended to represent a stock-specific or other investment recommendation, and our view of these holdings may change at any time based on stock price movements, new research conclusions, or changes in risk preference. Index information is included herein to show the general trend in the securities markets during the periods indicated and is not intended to imply that any referenced portfolio is similar to the indexes in either composition or volatility. Index returns are not an exact representation of any particular investment, as you cannot invest directly in an index. Alternative investments, including private equity, real assets, and hedge funds, are not suitable for all clients and are available only to qualified investors.