Executive Summary
- Earnings growth is the key driver of our constructive economic and market outlook for 2026. S&P 500 earnings are projected to rise 14.3%, underpinned by broadening sector strength and supportive fiscal policy, including nearly $200 billion in tax relief to U.S. households.
- Spending on AI infrastructure continues to drive economic activity. Investments in data centers, semiconductors, and cloud platforms exceeded $350 billion in 2025 — more than 1% of GDP — and are expected to remain a powerful tailwind.
- We maintain a disciplined overweight to high-quality companies with durable competitive advantages. With earnings accelerating, significant investment in innovation, and the Fed leaning toward further easing, we see compelling opportunity in AI, healthcare innovation, and global supply chain realignment.

The list of noteworthy developments in 2025 far exceeded anything that might be considered typical. From shifting trade policy to the rapid proliferation of artificial intelligence (AI), investors were challenged to separate meaningful signals from distracting noise, avoiding both overreaction to perceived risks and unwarranted enthusiasm that fueled pockets of risky speculation.
Maintaining this discipline will remain essential in navigating the year ahead, which promises continued rapid technological advancement, competing economic crosscurrents, and a midterm election poised to reshape the balance of power in Washington.
Resisting the Fear of Missing Out
Despite strong fundamentals, high-quality companies — defined by higher levels of profitability, reasonable levels of debt, and stable earnings growth — lagged the broader market in 2025. Investor enthusiasm instead concentrated on companies promising transformational technologies such as quantum computing, AI infrastructure, blockchain, and biotechnology, even when many of these firms are not yet generating a profit and in some cases producing no revenues at all (Exhibit 1).
Exhibit 1: Russell 2000 Small Cap Index: Profitable vs. Unprofitable Company 2025 Total Return
Key takeaway: A surge in speculative, momentum-driven stocks has led to the outperformance of lower-value companies in 2025.
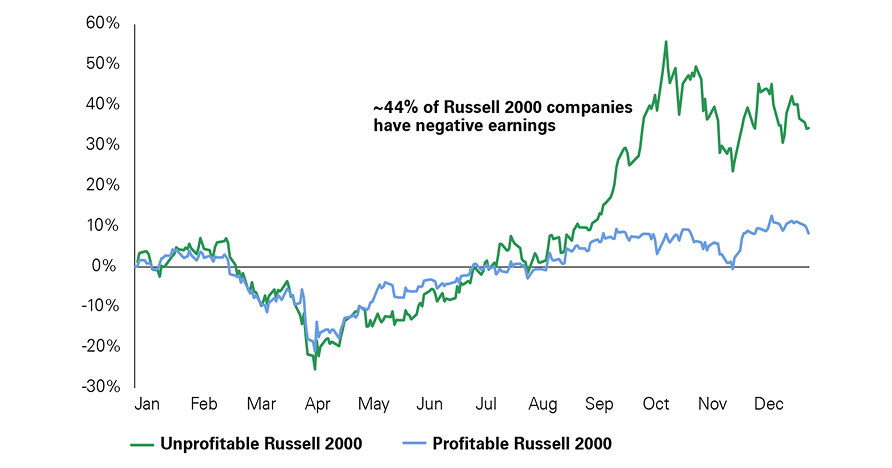
This line chart shows cumulative percentage performance over a single calendar year for two groups within the Russell 2000 index. The horizontal axis runs from January through December, while the vertical axis ranges from approximately –30% to +60%.
A green line represents unprofitable Russell 2000 companies, while a blue line represents profitable Russell 2000 companies. Both series begin the year close to 0%. During February and March, both groups decline sharply, reaching a trough in late March to early April. Unprofitable companies experience a deeper drawdown, falling to roughly –25%, while profitable companies bottom closer to –18%.
From April through the summer, both groups recover gradually. Around mid-year, performance converges near the zero line. Starting in August, unprofitable companies accelerate meaningfully, sharply outperforming profitable peers. The green line rises steeply through September and October, peaking near +55% before becoming volatile but remaining elevated into year-end around +35–40%.
Profitable companies show a more modest and stable recovery, ending the year near +10%. A text annotation on the chart states that approximately 44% of Russell 2000 companies have negative earnings, reinforcing the breadth of unprofitable firms driving the higher-beta rally. Overall, the chart highlights significant risk-on behavior and speculative leadership concentrated in unprofitable small-cap stocks.
Of course, many of the large technology companies engaging in large-scale AI investment (e.g., Nvidia, Google, Microsoft) are among the most fundamentally sound businesses in the world. However, a growing subset of market leadership has come from companies with weaker foundations or valuations that have significantly eroded future return potential. Historically, following sharp market corrections such as the one we experienced in April, investors have often gravitated toward “the next big thing,” favoring long-duration narratives over financial strength. While this behavior can produce short-term gains, it rarely persists.
Our discipline is to remain invested in businesses with the earnings power, balance sheet resilience, and competitive moats to grow steadily over long periods, while avoiding the low-quality momentum driven moves that helped propel market indexes higher in 2025. Since 2006, a systematic tilt toward quality has generated roughly 231% cumulative outperformance and has outperformed the market in 74% of rolling three-year periods.1
Fundamentals Lead the Way as Speculation Fades
As we look into 2026, our base case remains constructive for both equities and the broader economy. The most important driver of this view is the prospect of stronger earnings growth. Consensus forecasts call for S&P 500 earnings to rise by 14.3% this year, up from approximately 11.5% in 2025 (Exhibit 2). More than half of S&P 500 firms have issued full-year guidance ahead of expectations, led by healthcare, technology, and financials. Importantly, there is unusually low dispersion in analysts’ next-12-month estimates, which we believe signals a high degree of confidence in current outlooks.
Exhibit 2: S&P 500 Revenue and Earnings Growth
Key takeaway: Earnings growth has been robust and is expected to accelerate in 2026.
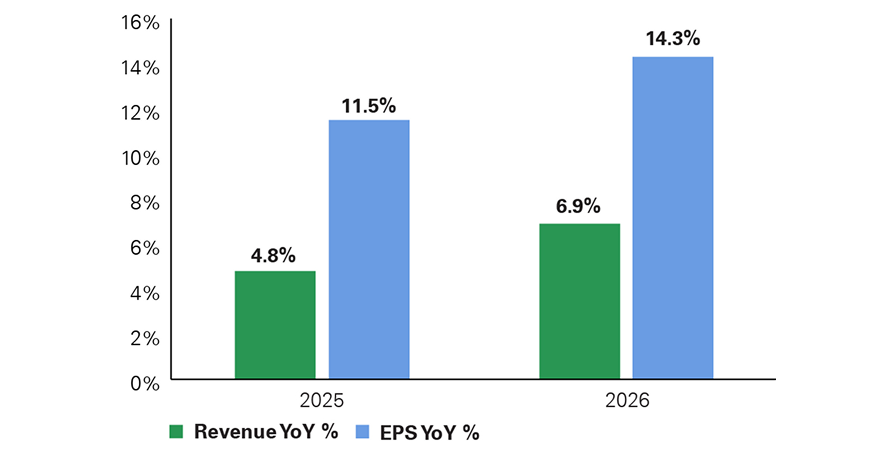
This grouped bar chart compares year-over-year percentage growth in earnings per share (EPS) and revenue for two forward years: 2025 and 2026. The vertical axis ranges from 0% to roughly 16%.
For each year, two bars are shown. Green bars represent EPS year-over-year growth, while light blue bars represent revenue year-over-year growth. In 2025, EPS growth is shown at 4.8%, while revenue growth is higher at 11.5%. In 2026, both metrics accelerate, with EPS growth increasing to 6.9% and revenue growth rising to 14.3%.
Numeric labels appear above each bar, reinforcing the precise values. The visual communicates that top-line growth is expected to materially outpace bottom-line growth in both years, though earnings leverage improves in 2026. The overall message is one of continued expansion, with operating leverage gradually inflecting but not yet fully closing the gap between revenue and earnings growth.
Corporate earnings growth is expected to broaden, providing a stable foundation for more evenly distributed market advances. Industrials, materials, and financials are projected to deliver some of the strongest gains, while aerospace and defense companies anticipate more than 50% earnings growth over the next 12 months. Within technology, leadership is shifting away from a handful of mega-cap companies to the wider ecosystem enabling AI adoption. Hyperscalers spent more than $350 billion on AI-related investment in 2025, equal to more than 1% of U.S. GDP, and their cumulative spending is expected to exceed $1 trillion over the next three years. This investment supports demand for semiconductors, electrical equipment, data center infrastructure, and software. Bessemer has exposure to hyperscaler AI spending across the data center value chain: Nvidia and Broadcom in AI compute and networking; TSMC and ASML on advanced semiconductor manufacturing and equipment; Caterpillar and GE Vernova supporting data center power and grid reliability; and Microsoft at the software and cloud platform layer.
We believe the economy will support the expected earnings growth discussed earlier. A major near-term boost comes from the One Big Beautiful Bill Act (OBBBA), which delivers roughly $191 billion in tax relief to households this year — serving as an offset to the bifurcated growth that has left lower-income cohorts behind. About $141 billion will flow into the economy in the first half of the year through refunds and reduced withholding, equal to almost 1% of GDP on an annualized basis. Historically, income boosts of this magnitude have lifted GDP by about 0.3% to 0.5%.
With midterms approaching and affordability concerns dominating voter sentiment, fiscal policy is likely to remain supportive. Beyond the OBBBA’s $191 billion in household tax relief, the administration has begun adjusting tariffs on selected goods to dampen consumer impacts. For example, in November, President Trump rolled back tariffs on over 200 food items. Any additional reductions in tariffs will likely further marginally boost economic growth.
Beyond fiscal policy support, the Fed continues to lean toward easing through additional interest rate cuts as the labor market cools. Inflation has stabilized near 3%, with tariff-related inflation expected to be temporary. With wage growth easing and pockets of labor softness emerging, markets expect the Federal Reserve to deliver around two to three rate cuts by late 2026, potentially bringing the policy rate close to 3%. Historically, falling interest rates paired with continued economic growth have supported risk assets.
Key Risks and How They Could Affect Markets
Markets tend to become more volatile in midterm election years. Since 1950, the S&P 500 has experienced an average peak-to-trough decline of about 17% in midterm years, noticeably larger than the typical 13% drawdown in non-midterm years. As investors navigate another likely shift in the balance of power in Washington this year, higher volatility may be a key feature of 2026. In special elections throughout 2025, Republicans gave up more than 15 percentage points to Democrats, consistent with a 43-seat House loss. In general, returns tend to be weaker heading into the elections before improving once the political outlook becomes clearer. This pattern suggests that uncertainty alone could elevate volatility in 2026, even if the economic backdrop remains supportive.
Geopolitical risk remains a key area to monitor, especially after the recent U.S. military operations on Venezuela that captured President Nicolás Maduro. While the market reaction has been limited, the operation intensified tensions with Europe and China and increased the likelihood of broader military conflicts that could introduce more volatility.
A third area of vulnerability is valuation. Equity prices today leave the market more sensitive than usual to shifts in interest rates, growth expectations, and investor sentiment. Strong earnings can offset some of that pressure, but elevated starting points naturally raise the bar for strong future returns.
Concentration risk also merits attention. Index performance is still heavily influenced by a narrow cohort of mega-cap technology companies. While these businesses remain fundamentally strong, any meaningful repricing could weigh on headline indexes regardless of broader corporate strength. This is one reason why diversification and careful stock selection remain essential when navigating the year ahead.
Putting It Together
Despite these risks, we remain positive on the outlook for 2026. Accelerating earnings, significant investment in innovation, supportive fiscal policy, and an increasingly accommodative Federal Reserve create a constructive backdrop.
At the same time, elevated valuations and election-year uncertainty argue for discipline. For long-term investors, maintaining exposure to high-quality businesses with durable competitive advantages remains the most reliable way to grow wealth across cycles.
In the following sections, we discuss key elements of our outlook in more detail.

AI-driven spending was the biggest swing factor for U.S. economic growth in 2025. It’s estimated that AI-related capital expenditures (capex) accounted for more than half of the GDP growth in the first half of 2025 and helped push full-year growth up to long-term trend levels of 2%. Going forward, we expect AI investment to remain a positive tailwind.
In the near term, the AI capex cycle generates a powerful feedback loop that stimulates economic growth across industries. For instance, utilities and power infrastructure companies are poised to benefit from surging data center electricity demand. We recognize that this is not indefinitely sustainable as the marginal return eventually diminishes enough to no longer justify further investment. However, we do not believe the current cycle is near that point. While absolute capex levels are at all-time highs, hyperscalers’ AI-related revenue metrics are also outperforming those of prior infrastructure projects at similar stages in their respective investment timelines. Microsoft’s Azure AI services’ capex-to-revenue ratio is already below 400%, compared to above 1,200% during the third year of its cloud platform buildout. For Amazon, AI services revenue is growing three times faster than its cloud platform did when total revenues were at similar levels.
From a macroeconomic standpoint, AI investment is estimated to increase U.S. GDP growth by 0.3% to 0.7% per year over the next decade. AI capex is expected to contribute approximately 0.3%, with the remaining growth coming from second-order effects in related industries and worker productivity gains. The Center for Economic and Policy Research (CEPR) estimates that AI could boost U.S. labor productivity growth by 0.4% to 0.9% per year over the next decade. Compared to a long-term productivity growth rate of 2%, this implies a moderate to substantial contribution. The wide estimation range reflects uncertainty around AI adoption rates across sectors and the magnitude of the Baumol effect,2 but gains on the low end of this range should still have a meaningful impact on real wage growth and consumer spending.
Over the past three years, the top five U.S. AI companies3 have generated a cumulative return of 266%, compared to 78% for the S&P 500. However, we do not believe the current AI investment environment has reached speculative bubble territory. The top AI enablers have much stronger fundamentals than the leading technology companies during the dot-com bubble, and they compare favorably across a variety of financial metrics (Exhibit 3). Moreover, the top five companies have an aggregate next 12-month P/E ratio of 27x, which is still 20x to 40x below peak levels for leading companies during the dot-com and Japanese asset bubbles.
Exhibit 3: Fundamentals of Today’s AI Leaders vs. Tech Bubble
Key takeaway: Fundamentals are generally notably stronger for today’s top AI companies than dot-com bubble era technology companies.
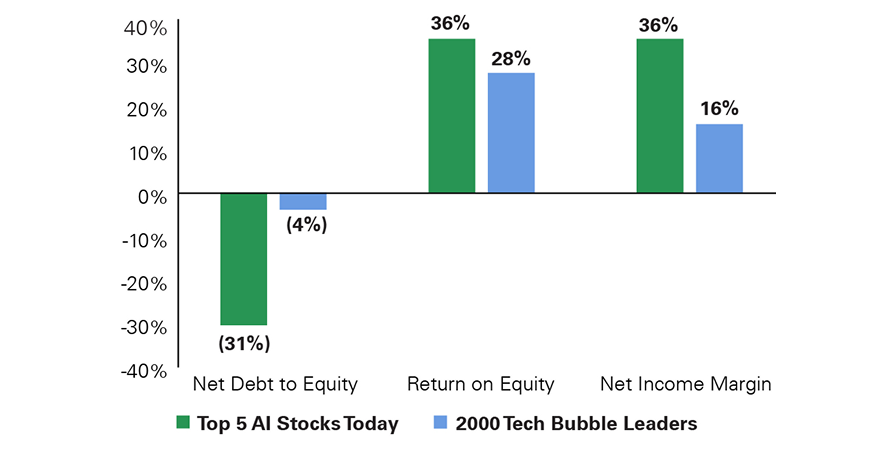
This bar chart compares three financial metrics across two cohorts: today’s top five AI-focused stocks and the leading technology stocks from the year 2000 tech bubble. The vertical axis spans from –40% to +40%.
For each metric, green bars represent the top AI stocks today, while blue bars represent 2000 tech bubble leaders. The first metric is Net Debt to Equity. Top AI stocks show a negative value of approximately –31%, indicating net cash positions, while 2000 tech leaders show a modest negative value near –4%.
The second metric is Return on Equity. Top AI stocks exhibit a very high return of approximately 36%, compared with about 28% for tech leaders in 2000.
The third metric is Net Income Margin. Top AI stocks again show roughly 36%, while 2000 tech bubble leaders display materially lower margins near 16%.
Each bar is labeled with its percentage value. The chart underscores that today’s AI leaders are not only growth-oriented but also significantly stronger in profitability, balance-sheet health, and capital efficiency than prior-cycle technology leaders.
At the same time, we recognize that a speculative bubble is not a necessary condition for a market correction. We believe thoughtful stock selection will become increasingly important as the industry matures, and we continuously make tactical adjustments to better position our portfolios. For example, we recently increased exposure to Alphabet to reflect our belief that the company’s AI development capabilities are underappreciated by the market. Alphabet’s latest large language model (LLM), Gemini 3, far exceeded expectations and outperformed OpenAI’s GPT-5 Pro in a key benchmark test. In addition, the company has maintained its lead in autonomous driving, an AI technology that is often overshadowed by LLMs.

Growing at roughly 2.6% in 2025, consumption supported economic growth, but underlying trends revealed a clear bifurcation. Concentration defined much of the economic landscape in 2025, spanning equity markets, earnings, and capital spending — and consumption patterns reflected the same dynamic. The year was marked by a K-shaped economic expansion: Higher-income, asset-owning households benefited from rising equity and home values and relatively stable employment, while lower-income households faced disproportionate pressure from inflation, a softer labor market, and weaker real wage growth.
This divergence was masked by concentrated spending for the top income cohort, with the wealthiest 10% of consumers accounting for roughly half of total consumption, the highest we have seen in history, leaving overall demand increasingly reliant on affluent households. Rising asset prices have reinforced this dynamic by disproportionately benefiting households that hold the most equity and housing wealth and are less sensitive to economic cycles.
By contrast, labor market dynamics are weighing more heavily on lower-income consumers. Wage growth is increasingly bifurcated, with the highest quartile of the wage distribution seeing growth above its 10-year average, while the lowest quartile is experiencing wage growth near decade lows (Exhibit 4). Rising subprime auto loan delinquencies and a growing share of consumers making only minimum credit card payments point to early signs of financial stress, though not yet at levels historically associated with a sharp contraction in consumption.
Exhibit 4: Atlanta Fed Median Nominal Wage Growth
Key takeaway: A key driver of the K-shaped divergence has been wage dynamics, with wage growth slowing far more sharply for bottom-quartile earners than for the top quartile, reversing post-pandemic trends.
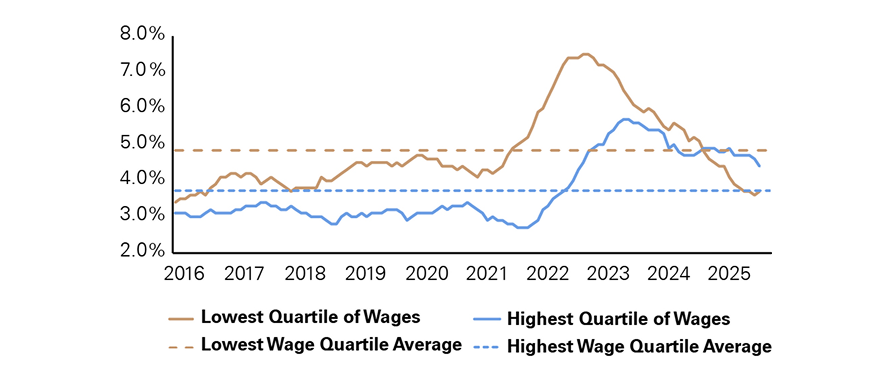
This line chart tracks wage growth rates over time for the lowest and highest income quartiles from 2016 through 2025. The vertical axis ranges from approximately 2% to 8%.
A brown line represents the lowest quartile of wages, while a blue line represents the highest quartile. Dashed horizontal lines indicate the long-term average wage growth for each group, with the lowest quartile average near 4.8% and the highest quartile average near 3.6%.
From 2016 through 2019, both groups experience relatively stable wage growth, with the lowest quartile consistently above the highest quartile. During the pandemic period and into 2022, wage growth for the lowest quartile accelerates sharply, peaking above 7%, while the highest quartile also rises but to a lower peak near 5.5%.
From 2023 onward, both lines trend downward. By 2025, wage growth for the lowest quartile falls slightly below its long-term average, while the highest quartile converges near its historical average. The chart highlights compression in wage growth momentum and a normalization following an unusually tight labor market.
With consumption representing roughly 70% of GDP, sustained consumer strength remains essential to the economic expansion. While 2025 was defined by concentration, we believe 2026 has the potential to mark a gradual broadening in consumer spending, albeit not a full leveling across income cohorts. Several catalysts could support this shift, including continued disinflation, lower interest rates that improve credit conditions, stabilization in labor markets, and targeted fiscal support.
Fiscal stimulus could provide the most immediate boost. Tax refunds are expected to rise substantially in the first half of the year, with estimates of around $141 billion, largely benefiting lower-income cohorts. While this represents roughly 2% of annual retail sales, well below the approximately 5% delivered through pandemic-era stimulus, that period demonstrated the outsized impact transfers can have on consumption across the income spectrum. Notably, households in the bottom third of the savings distribution spent an estimated 20% to 30% of their stimulus payments within three months of receipt.
As a result, while higher-income consumers are likely to continue propelling growth in the near term, these dynamics increase the probability that consumption will gradually broaden to include lower- and middle-income households. A sharply weakening labor market would challenge this outlook, but under a base case of labor market stability and incremental fiscal support, consumption should remain resilient.
While consumer discretionary and consumer staples lagged the S&P 500 in 2025, the consumer discretionary sector has shown signs of renewed momentum in recent weeks, potentially signaling early optimism for selective areas of consumer spending in 2026. Within portfolios, we have leaned into the K-shaped economy through exposure to luxury brands such as LVMH and Moncler, reflecting the continued strength of high-income consumers. At the same time, we have selectively added exposure to goods categories that stand to benefit from lower interest rates and a broadening consumption base, including Lowe’s.
In anticipation of next year’s global events such as the FIFA World Cup, we believe experiential spending is likely to accelerate in 2026, which led to portfolio additions such as Live Nation. Travel demand also remains robust, with TSA throughput reaching record levels in December, supporting portfolio exposure to companies such as Hilton Worldwide Holdings and Royal Caribbean Cruises.

The Federal Reserve has lowered interest rates by 175 basis points since the beginning of its easing cycle in September 2024, a pace of cuts rarely seen outside of a recession. Looking ahead, that pace is expected to slow, with the Fed’s December Summary of Economic Projections calling for just one 25-basis-point cut this year. With upside risks to inflation and downside risks to the labor market, the Fed faces a difficult, yet navigable, backdrop heading into the year.
On inflation, Chair Powell noted at the December Federal Open Market Committee meeting that much of the above-target inflation has been driven by tariffs. The Fed has stated that it intends to look past exogenous, one-time price shocks as long as inflation expectations, a gauge of the Fed’s credibility, remain well-anchored. Short-term inflation expectations briefly rose after the Liberation Day tariff announcements but have since eased, while longer-term expectations have remained steady near pre-pandemic levels.
We expect tariff-related price pressures to peak in early 2026 before gradually easing. This reflects the frontloaded nature of tariff impacts, which mechanically cause a one-time price increase before their influence diminishes as year-over-year inflation comparisons normalize. Still, tariffs largely affect core goods, which account for only about 18% of the CPI basket. These dynamics are reinforced by ongoing moderation in core services inflation, the largest component of CPI at more than 60% of the basket. In the November CPI report, core services made its smallest contribution to inflation since 2021, reflecting continued shelter disinflation and broader cooling across services. As tariff effects fade and underlying disinflationary trends persist, inflation should continue toward the Fed’s 2% target this year.
With tariff effects likely to reflect a one-time price shift and services disinflation continuing, we expect the Fed to place greater emphasis on labor market weakness. While layoffs remain generally stable, slower hiring, which is more closely linked to rising unemployment (Exhibit 5), briefly pushed the unemployment rate to a four-year high of 4.6%. As hiring slows and unemployment rises, it weakens consumer demand and increases the risk of layoffs, reinforcing the cycle. Given this dynamic and current underlying softness, we believe the labor market will be the primary driver of monetary policy in 2026, and the Fed is prepared to prevent additional weakness with further easing. Against this backdrop, we expect the Fed to have more room to cut rates this year than it anticipates.
Exhibit 5: Hiring Rate vs. Unemployment Rate
Key takeaway: Increases in the unemployment rate have a stronger correlation to declines in hiring rates.
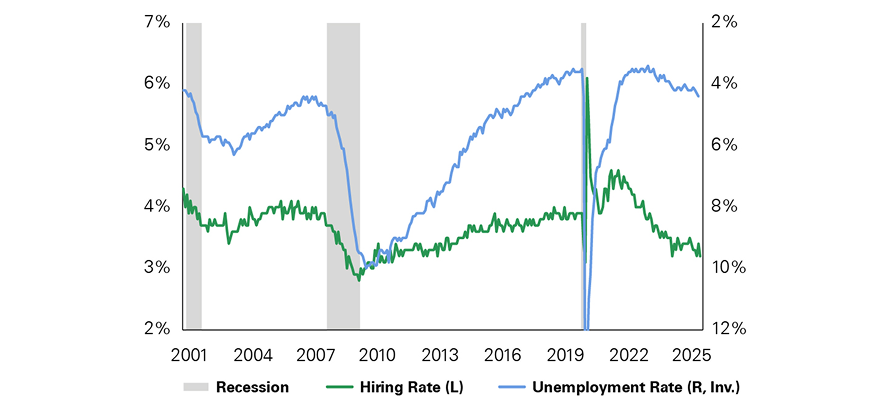
This dual-axis line chart shows U.S. hiring rates and unemployment rates from 2001 through 2025, with shaded gray vertical bands marking recession periods.
The left vertical axis ranges from roughly 2% to 7% and corresponds to the hiring rate, shown as a green line. The right vertical axis is inverted, ranging from approximately 2% at the top to 12% at the bottom, and corresponds to the unemployment rate, shown as a blue line.
During recession periods in the early 2000s, the Great Financial Crisis, and 2020, hiring rates decline sharply while unemployment spikes. The inverse relationship between the two series is visually reinforced by the inverted right axis.
Following the 2020 recession, unemployment drops rapidly to historic lows while hiring rates surge, peaking around 2022. From 2023 through 2025, hiring rates trend downward while unemployment edges modestly higher, signaling labor-market normalization rather than stress. The chart provides context for cyclical labor dynamics and turning points across economic cycles.
While 2025 was a year of political transition, 2026 will be a year of monetary policy transition, with a new Federal Reserve chair beginning in June. This change has raised concerns about potential politicization, though it is important to remember that the Fed chair is only one vote among 12. Absent a clear economic rationale, it would be difficult for any chair to secure the seven-member majority needed to change policy.
Additionally, cutting rates faster than the data justify could lift inflation expectations and increase long-end Treasury yields, where lending such as for auto loans (four to seven years) and mortgages (15 to 30 years) occurs, undermining efforts to lower financing costs. Ultimately, a data-dependent approach committed to maximum employment and price stability remains in the best interest of both the Fed and the administration.
Overall, inflation should trend toward 2% over time, though tariffs may cause uneven progress, while labor-market softening supports further easing. While concerns about political pressure on the Fed are valid, its institutional structure and sensitivity to financial conditions limit the likelihood of politically driven policy moves, in our view. Ultimately, we expect the Fed to stay data-dependent, preserving its credibility while navigating a complex policy landscape.

International markets are entering somewhat of a sweet spot heading into 2026. With tariff uncertainty largely resolved, countries, companies, and consumers are adjusting to the new environment. Fiscal stimulus, broad-based monetary easing by 85% of central banks (Exhibit 6), and a softer dollar suggest that global growth is poised for its most robust year in several years.
Exhibit 6: Global Central Banks Rolling 18-Month Cumulative Number of Rate Cuts
Key takeaway: Outside of the Global Financial Crisis and the COVID-19 pandemic, this global easing cycle is one of the largest in recent history.
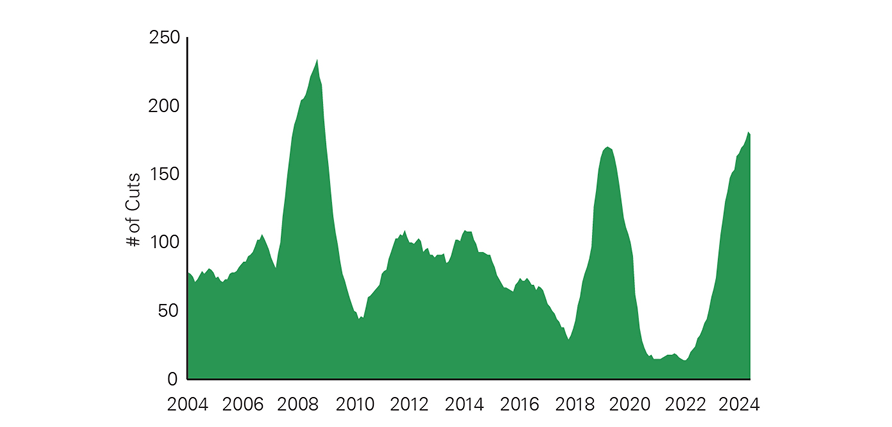
This area chart displays the number of corporate layoffs or job cuts announced annually from 2004 through 2024. The vertical axis ranges from 0 to approximately 250 cuts, while the horizontal axis tracks time by year.
The filled green area shows periods of elevated layoff activity. Significant spikes appear during the 2007–2009 financial crisis, peaking above 200 cuts, and again around 2020, reflecting pandemic-driven restructuring. A pronounced trough occurs around 2021–2022, when layoff activity falls to very low levels.
From 2023 into 2024, layoffs rise sharply again, approaching levels comparable to prior downturns. The chart visually communicates that recent layoff announcements represent a meaningful re-acceleration after an unusually subdued period, consistent with broader corporate cost-discipline and margin-protection strategies.
Europe faces cyclical and demographic challenges, but it offers targeted opportunities. Germany’s industrial sector, while under strain, is repositioning toward higher-value production that is less vulnerable to Chinese overcapacity and reliance on Russian energy. Industries linked to the energy transition and defense stand to benefit from reshoring efforts, heightened security priorities, and ongoing climate investment.
The European Central Bank has acted ahead of the Federal Reserve in cutting rates to normalize policy and support growth. With inflation expectations well anchored, real rates are supportive of equity valuations. Since mid-2024, domestic demand has strengthened, supported by recovering real incomes. Looking ahead, increased fiscal spending, driven by green industrial policy and rising defense budgets, reinforces our constructive stance. However, elevated public debt levels and political fragmentation favor a selective, company-led investment approach over broad regional exposure.
Japan’s corporate reform continues to gain traction. Years of governance improvements are finally lifting returns on equity and strengthening shareholder alignment, resulting in the stock market moving past its 1989 peak. Rising foreign ownership of Japanese equities and further private equity deals will, in our view, hold companies accountable to global standards, pressuring management teams even further to deploy capital more efficiently. With valuations still below those of U.S. peers and the yen among the cheapest major currencies, Japanese equities present a rare combination of structural improvement and an attractive entry point.
We maintain a tactical underweight in emerging markets, largely due to our underweight position in China. The broad emerging markets index remains heavily skewed toward China and capital-intensive sectors such as financials and commodities, which are less aligned with current growth drivers. In our view, persistent governance risks and political interference further weaken the case for broad-based exposure.
Although China challenges the U.S. on the technological front, its broader economy continues to be held back by structural challenges. A declining workforce, ongoing weakness in the property sector, and growing state intervention are all contributing to a structurally slower economic expansion. These factors are also keeping Chinese assets trading at a persistent valuation discount. Beijing’s recent push to curb excessive industrial competition, known as the “anti-involution” campaign, is helping reduce destructive price wars and protect corporate margins. However, this comes at a cost: weaker fixed-asset investment, which in turn weighs on overall economic growth.
Within broader emerging markets, Bessemer portfolios maintain targeted exposure to India, Southeast Asia, and Mexico, which we view as the clearest beneficiaries of global supply chain realignment and favorable demographic trends. These allocations are underpinned by durable structural tailwinds, particularly in India, where accelerating digitalization, a young workforce, and an expanding manufacturing base are supporting long-term growth.
Looking ahead, we expect international equity markets to reward selective stock picking over broad-based exposure. Bessemer portfolios are overweight Japan and select European markets, while underweight broad emerging markets, guided by a disciplined approach to policy and governance risks.

Advancements in quantum computing have accelerated the technology to the forefront of investors’ discussions surrounding the future of computing. Recent technical milestones achieved by Google, IBM, Microsoft, and others have drawn attention well beyond academic and research communities. Investors have taken notice: The potential of quantum computing is increasingly reflected in forecasts and valuation frameworks. It is no longer viewed as merely a “science project.”
Quantum computing exploits the fundamental laws of physics. Its power and promise stem from leveraging quantum mechanical behavior at the particle and atomic levels, enabling a computing paradigm that is fundamentally more powerful than classical computing systems. Quantum computing is not simply a faster version of classical computing; it represents an entirely different computational model. By operating at the atomic scale, quantum systems open the door to solving new classes of problems, particularly in materials science, drug discovery, and complex optimization challenges across transportation, logistics, and finance.
As a result, investment opportunities are beginning to emerge. Leading concepts and business models in quantum computing now feature prominently within major technology companies such as Microsoft, Amazon, Google, and IBM. While still speculative, the share prices of several pure-play quantum computing companies surged in 2025, reflecting growing investor interest in the space.
The current state of quantum computing technology is commonly described as “noisy intermediate-scale quantum” (NISQ). At this stage, quantum systems remain highly sensitive to external disturbances such as heat, vibration, and electromagnetic interference, which can introduce instability and errors at the particle level. Most researchers believe the industry must achieve “fault-tolerant quantum computing” (FTQC) before large-scale commercial deployment becomes viable. FTQC depends on the successful implementation of robust quantum error-correction techniques, arguably the key technical challenge.
Industry experts anticipate FTQC emerging in the early 2030s, with IBM’s public roadmap forecasting fault tolerance as early as 2029 (Exhibit 7). In the interim, quantum advantage, defined as solving commercially relevant real-world problems faster or more effectively than classical computers, may be achieved within the next several years, but well before 2030. Google, IBM, and others reported encouraging progress toward this milestone last year, though meaningful technical challenges remain.
Exhibit 7: Quantum Computing Development Timeline — IBM Example
Key takeaway: The roadmap outlines a phased path from hybrid quantum high-performance computing (HPC) tools and error mitigation today to large-scale, fault-tolerant quantum systems over the next decade.
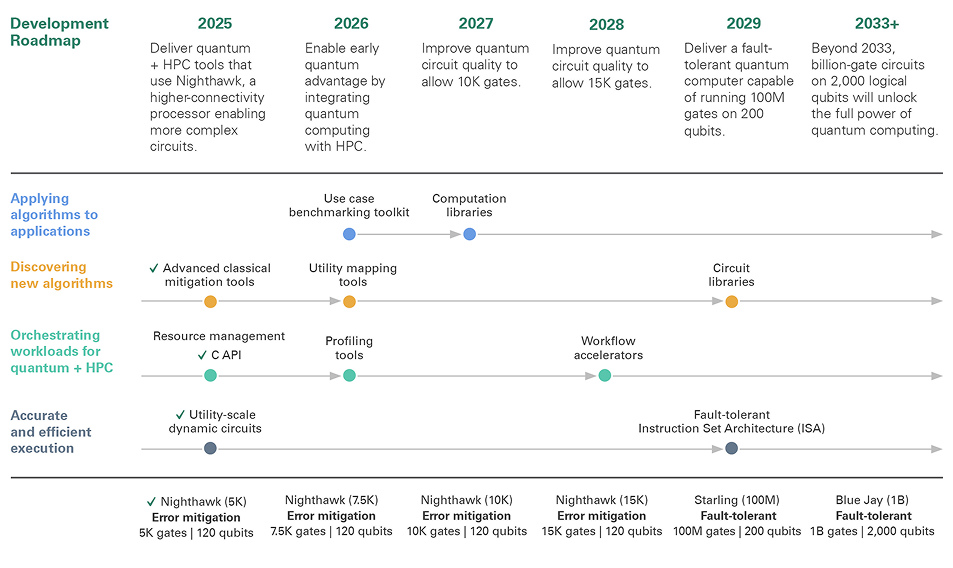
The roadmap outlines a phased path from hybrid quantum high-performance computing (HPC) tools and error mitigation today to large-scale, fault-tolerant quantum systems over the next decade.
The total addressable market (TAM) for quantum computing is potentially substantial, but forecasts vary widely due to the technology’s early stage of development. Some consulting firms estimate a $100–$200 billion opportunity for quantum hardware and software vendors by 2040. Other industry participants believe quantum computing could unlock $1–$2 trillion in economic value across key end markets and applications. Regardless of the precise projections, investment in quantum R&D continues to accelerate, and announcements highlighting early demonstration successes are becoming more frequent.
Large technology companies appear to be leading the race. Google, Amazon, IBM, and Microsoft all maintain significant and well-funded quantum computing programs. To date, IBM appears to lead on several key metrics, with Google frequently close behind.
Alongside these incumbents, a number of pure-play companies, including D-Wave Quantum, IonQ, Quantum Computing Inc., and Rigetti Computing, are pursuing a variety of approaches and business models. Broadly speaking, large technology firms are targeting quantum computing as an extension of their cloud platforms, positioning it as an incremental service layered onto existing cloud infrastructure.
At Bessemer Trust, we are paying close attention to developments across the quantum computing landscape. We are also invested in leading companies that are positioned to benefit from continued progress in and, ultimately, commercial deployment of quantum computing technologies.
We continue to see reasons for optimism in 2026: A robust earnings outlook, meaningful household stimulus, and investment in transformative technologies are laying the groundwork for continued growth. Meanwhile, disinflation, monetary easing, and greater clarity on trade policy are creating a more constructive macro backdrop.
That said, we are mindful of the risks ahead. Election year dynamics, narrow market leadership, and elevated valuations warrant disciplined portfolio management. These uncertainties underscore the importance of maintaining a quality bias and focusing on areas where fundamentals and long-term growth prospects remain strongest. We’ll continue to monitor developments closely and share our perspectives through ongoing communications. As always, we welcome your engagement. Please reach out to your Bessemer advisor with any questions.
- Analysis based on the MSCI ACWI Quality Index. The index aims to capture the performance of quality growth stocks by identifying those with high-quality scores based on three fundamental variables: high return on equity (ROE), stable year-over-year earnings growth, and low financial leverage. Cumulative and rolling outperformance is relative to the broad MSCI ACWI Index.
- A Baumol effect occurs when high productivity gains are concentrated in a few sectors, but workers in sectors with stagnant productivity gains (such as essential services) begin to also demand higher pay. As a result, the productivity gains per unit of labor cost are diluted at the overall economy level.
- Nvidia, Microsoft, Alphabet, Amazon, and Meta.
This material is for your general information. It does not take into account the particular investment objectives, financial situation, or needs of individual clients. This material is based upon information obtained from various sources that Bessemer Trust believes to be reliable, but Bessemer makes no representation or warranty with respect to the accuracy or completeness of such information. The views expressed herein do not constitute legal or tax advice; are current only as of the date indicated; and are subject to change without notice. Forecasts may not be realized due to a variety of factors, including changes in economic growth, corporate profitability, geopolitical conditions, and inflation. Bessemer Trust or its clients may have investments in the securities discussed herein, and this material does not constitute an investment recommendation by Bessemer Trust or an offering of such securities, and our view of these holdings may change at any time based on stock price movements, new research conclusions, or changes in risk preference.