

Quarterly Investment Perspective | Q3 2026

The AI Capex Cycle: How Sustainable Is the Buildout?

Executive Summary

  • AI investment has become a significant driver of economic growth and is approaching the scale of some of the largest productive capital-spending cycles in history.
  • Unlike many past investment booms, current AI spending is supported by strong demand, substantial customer commitments, and generally healthy corporate balance sheets.
  • The ultimate test of the cycle will be whether AI adoption generates meaningful productivity gains and sustainable revenue growth sufficient to justify today’s level of investment.
  • As the AI buildout evolves, opportunities may increasingly emerge among companies providing the infrastructure, networking, power, and other inputs needed to support growing demand.
In this Issue
Jeff-Mills
Chief Investment Officer

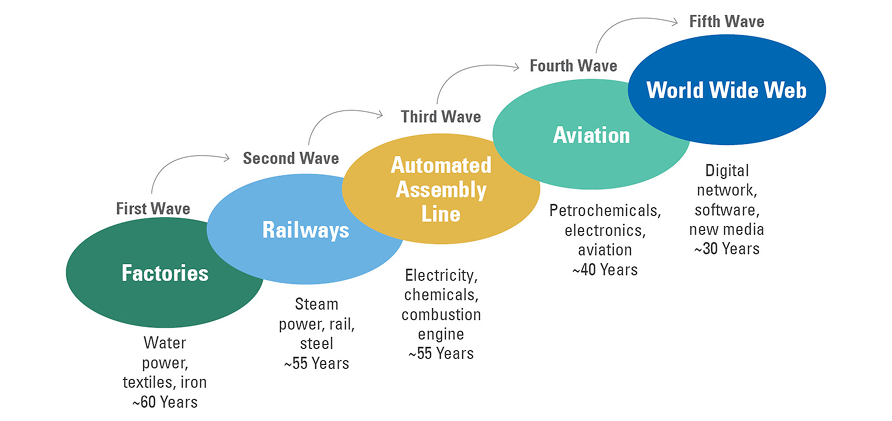
From railroads and highways to computers and the internet, transformative technologies have often been accompanied by waves of investment that reshape industries and influence economic growth for years to come (Exhibit 1). The challenge for investors is determining whether a new investment cycle is laying the foundation for future growth or whether expectations are getting ahead of reality.

The artificial intelligence (AI) buildout has quickly become one of the largest technology infrastructure investment cycles in recent decades. Spending on semiconductors, networking infrastructure, data centers, software, and power generation continues to accelerate, raising questions about how long the cycle can persist and whether the eventual returns will justify the scale of investment.

So far, the evidence suggests the cycle rests on firmer ground than many past investment booms. Demand remains strong, investment is increasingly tied to commercial adoption, and the economic effects are beginning to extend beyond the companies making the investments themselves. At the same time, the long-term success of the cycle will depend on whether AI adoption translates into meaningful productivity gains, sustainable revenue growth, and attractive returns on capital.

Exhibit 1: Five Long-Term Innovation Cycles Accelerated the U.S. Economy Forward

Key takeaway: Innovation cycles ultimately lift productivity and economic growth.

As of April 6, 2026. Source: Morgan Stanley, World Economic Forum -- activate to enhance object.

Chart 1 — Innovation waves
Alt text: Timeline-style diagram showing five innovation waves: factories powered by water, textiles, and iron over about 60 years; railways powered by steam, rail, and steel over about 55 years; automated assembly lines powered by electricity, chemicals, and combustion engines over about 55 years; aviation powered by petrochemicals, electronics, and aviation over about 40 years; and the World Wide Web powered by digital networks, software, and new media over about 30 years.

As of April 6, 2026. Source: Morgan Stanley, World Economic Forum

In this Quarterly Investment Perspective, we examine the forces driving the AI capex cycle, compare it with historical investment booms, explore where opportunities may emerge as the buildout evolves, and highlight the key risks and indicators we believe investors should monitor going forward.

    Capital spending (capex) is soaring in the U.S., with AI infrastructure a driving force. AI-related capex includes data center and power construction, information processing equipment, and software, all of which account for about one-third of business investment. There are currently more than 4,000 data centers in the U.S., with more than 2,500 in development. High-tech equipment is needed to operate data center facilities, including racks, servers, mainframes, and cooling systems, while software is required to run the equipment. The scale of this buildout is already having a measurable impact on economic activity, contributing about 1 percentage point to real GDP growth in 2025 and 1.5 percentage points to real GDP growth in the first quarter of 2026, although the net impact is lower by about half due to imports of high-tech equipment. Higher imports, however, mean higher exports elsewhere because AI investment is global. For example, the U.S. share of global data center capacity is 40%, followed by Asia-Pacific, with Europe a distant third.

    The key question is whether this level of investment can be sustained. In our view, the answer depends largely on three factors: the strength of demand, the financial capacity of those making the investments, and whether AI adoption ultimately translates into meaningful productivity gains.

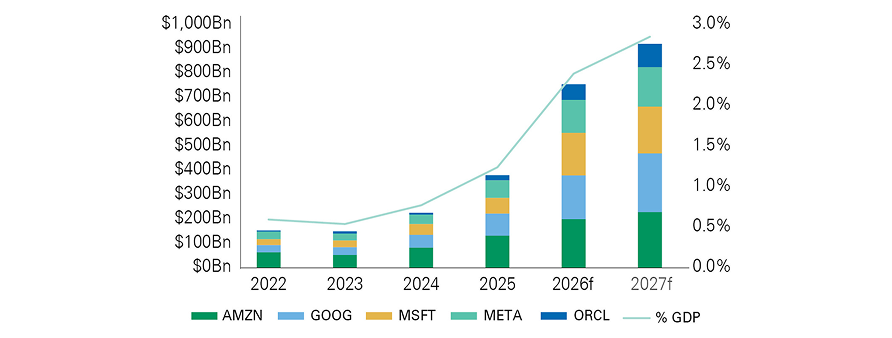
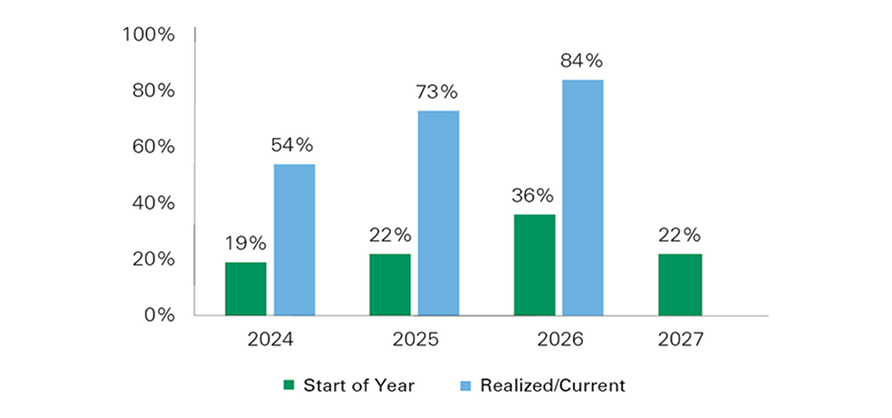
    Hyperscalers such as Alphabet, Amazon, Meta, Microsoft, and Oracle continue to drive AI investment and therefore sit at the center of oversupply concerns. Hyperscaler capex is expected to reach $750 billion in 2026, or 84% year- over-year, possibly the peak year for AI capex growth (Exhibit 2). Estimates have continued to rise since the start of the year thanks to accelerating demand, with 2027 consensus projections at $920 billion (22% year-over-year).

    Exhibit 2: Hyperscaler Capital Spending Continues to Accelerate

    Key takeaway: Hyperscaler capex is becoming a significant portion of GDP.

    Exhibit 2: Hyperscaler Capital Spending Continues to Accelerate -- activate to enhance object.

    Chart 2 — Hyperscaler spending and GDP share
    Alt text: Stacked bar chart showing combined capital spending by Amazon, Google, Microsoft, Meta, and Oracle rising sharply from about $140 billion in 2022 to about $920 billion forecasted in 2027. A line shows the spending share of GDP increasing from roughly 0.6% in 2022 to nearly 3.0% in 2027.

    As of May 31, 2026. Source: Bloomberg

    The ability to sustain this spending depends not only on demand but also on financial flexibility. While capex-to-sales ratios have risen and external financing has increased, hyperscaler balance sheets generally remain healthy. Excluding Oracle, whose weaker balance sheet characteristics skew aggregate figures, net debt remains near zero on average (versus -1x in 2019) and free cash flow yields have changed little despite the surge in spending. Solid balance sheets make capex less sensitive to tighter financial conditions, such as the recent backup in bond yields.

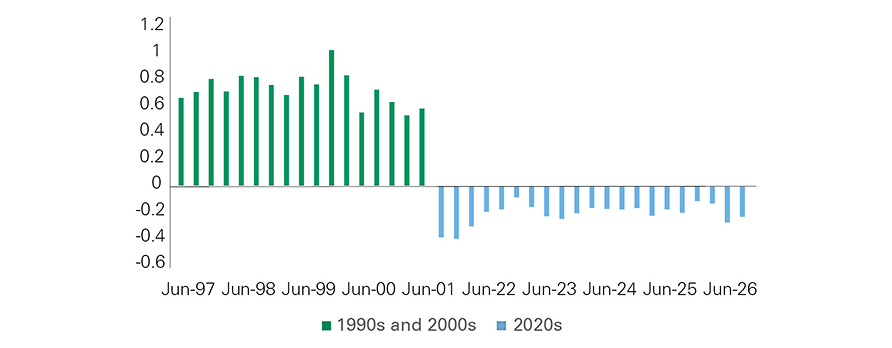
    Still, the sustainability of hyperscaler-led AI investment remains heavily predicated on demand. GPU rental rates, cloud gross margins, and backlog commitments continue to point to a market characterized by excess demand rather than excess capacity. Accelerating revenue backlogs and resilient profitability in the latest Q1 earnings season suggest that 2026 may not be the year of peak capex, and it may be significantly underestimated for the fourth year in a row (Exhibit 3). Token demand, energy intensity, and input costs also will impact capex plans. Token demand is projected to continue to accelerate on the back of enterprise agents. Swings in the Silicon Data LLM Expenditure index will be watched carefully but can be difficult to interpret, as declines may be indicative of reallocation toward cheaper models and not falling demand. 

    Exhibit 3: AI Capex Forecasts Have Consistently Moved Higher

    Key takeaway: Serial upward revisions are likely to continue into 2027.

    Exhibit 3: AI Capex Forecasts Have Consistently Moved Higher -- activate to enhance object.

    Chart 3 — 1990s/2000s versus 2020s comparison
    Alt text: Bar chart comparing positive values from the late 1990s and early 2000s with negative values in the 2020s. Green bars from Jun-97 to Jun-01 are mostly between 0.5 and 1.0, while blue bars from the 2020s are mostly between -0.1 and -0.4.

    As of June 10, 2026. Source: FactSet, Goldman Sachs

    How AI capex impacts growth, productivity, and inflation will be important. Capex cycles are positive supply shocks but can be inflationary in the short term. Three main sources of inflation are rising prices of electronic inputs (e.g., memory) due to exceptional demand for AI infrastructure, higher software prices (e.g., subscriptions) reflecting new AI features, and higher electricity prices on data center demand. To the extent that the current capex cycle acts as a demand shock for an extended period — with the inflationary impact outweighing the disinflationary impact of higher productivity — the central bank may be forced to raise interest rates.

    However, risks of an inflationary demand shock are somewhat overblown, in our view. The AI buildout is far less labor-intensive than has been the case historically, limiting broader wage pressures. The main channel would be through data center construction, a key source of AI-related job growth but a small share of GDP (0.2%). Once opened, data centers rarely need more than a few hundred employees.

    Realized productivity gains are a key unknown. Productivity growth not only extends the business cycle and acts as a powerful disinflationary force, but it also underpins end-user demand and durable AI revenue streams. The Census Bureau estimates AI adoption rates currently average 20% with expected usage rising to 23% within the next six months. During the Q1 earnings season, 54% of companies discussed AI in the context of productivity though it was difficult to quantify. But there is early evidence that labor productivity is accelerating in industries with high AI exposure, driven by higher output and not labor displacement. Still, productivity impacts can take years to materialize, and estimates of AI’s effect on labor productivity growth range from virtually zero to nearly 3%.

      Historical comparisons can help answer two important questions: how long major investment cycles tend to last and what factors have historically caused them to slow. By several measures, the current AI buildout is already approaching the scale of some of the largest technology investment cycles of the modern era.

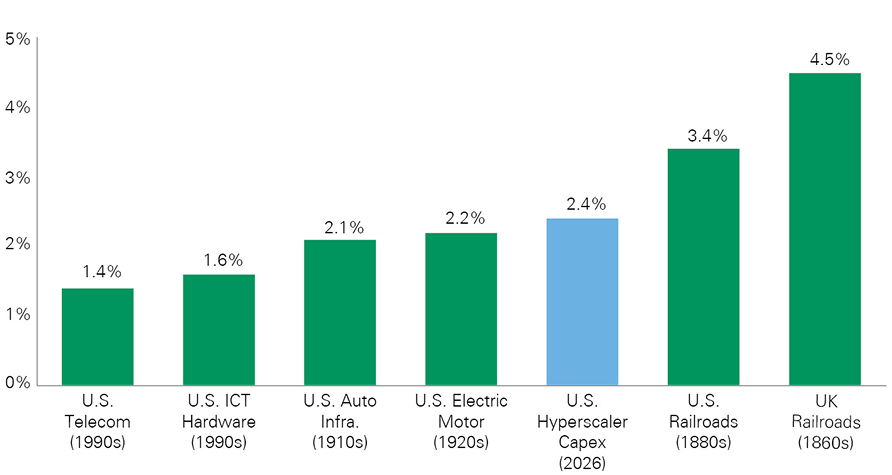
      Projected AI capex of 2.4% of GDP in 2026 exceeds that of the telecom, ICT (information and communication technology) hardware, and automobile buildouts (Exhibit 4) and is projected to rise further to 2.8% in 2027. If more bullish forecasts play out ($1.1 to $1.4 trillion), capex will rise to more than 4% of GDP, on par with the railroad booms.

      Exhibit 4: AI Investment Is Approaching the Scale of Major Historical Buildouts

      Key takeaway: Hyperscaler capex has surpassed some previous capex cycle peaks.

      Key Takeaway: Hyperscaler capex has surpassed some previous capex cycle peaks. -- activate to enhance object.

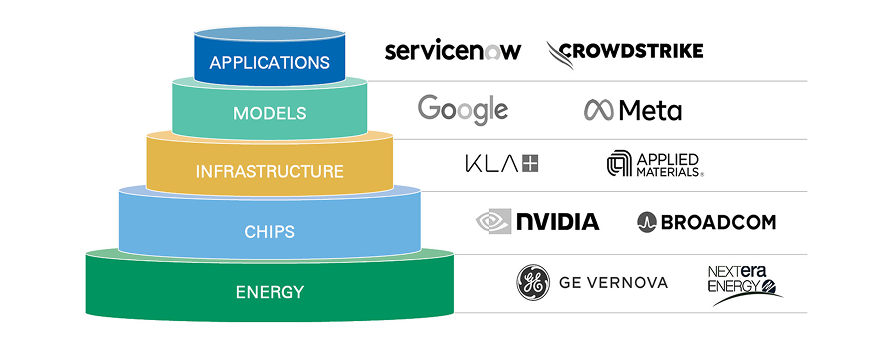
      Chart 4 — AI technology stack
      Alt text: Pyramid diagram of the AI technology stack with five layers from bottom to top: energy, chips, infrastructure, models, and applications. Example companies are listed beside each layer: GE Vernova and NextEra Energy for energy; NVIDIA and Broadcom for chips; KLA and Applied Materials for infrastructure; Google and Meta for models; and ServiceNow and CrowdStrike for applications.

      As of June 10, 2026. Source: Bessemer Trust, Goldman Sachs

      History suggests that changes in financial conditions are among the most common catalysts for both booms and busts. As economic historian Charles Kindleberger observed, tighter liquidity weighs on demand and corporate balance sheets, in turn weighing on capex and transitioning the cycle to a state of oversupply. Ahead of the telecom bubble’s collapse, the federal funds rate was raised 175 basis points through May 2000 and the 10-year yield surged to nearly 7% in early 2000. Tighter conditions forced telecom companies to scale back spending as liquidity dried up and refinancing costs increased. Risk of an extended Fed tightening cycle is low today, but it is something we watch closely.

      The health of corporate balance sheets and the strength of underlying state of excess demand also distinguish today’s cycle from the telecom boom. Telecom providers of the 1990s largely built speculative network capacity ahead of demand and competed in a commoditized bandwidth market. Today’s hyperscalers are investing in response to unprecedented contracted demand, with cloud backlog commitments exceeding $2 trillion across major providers in Q1. Their customers are not speculative startups with weak balance sheets but large-cap companies that generally maintain stronger balance sheets than many technology companies did in the 1990s (Exhibit 5).

      Exhibit 5: The Net Debt to EBITDA Ratio of the Top 10 Companies in the S&P 500 Is Healthier than the 1990s

      Key takeaway: The AI capex cycle is beginning from a much stronger balance sheet position.

      Exhibit 5: The Net Debt to EBITDA Ratio of the Top 10 Companies in the S&P 500 Is Healthier than the 1990s Key Takeaway: The AI capex cycle is beginning from a much stronger balance sheet position. -- activate to enhance object.

      Chart 5 — AI model performance over time
      Alt text: Line chart comparing AI model performance scores for Alibaba, Anthropic, DeepSeek, Google, OpenAI, and xAI from June 2024 to January 2026. Scores generally rise from the mid-40s to mid-60s in 2024 to the high-70s or low-80s by early 2026, with several models dipping in late 2025 before rebounding.

      As of June 16, 2026. Source: Bloomberg

      Business models have also evolved. AWS, Azure, and Google Cloud are not just infrastructure providers; they increasingly serve as the distribution, security, governance, and deployment layer for enterprise AI. As adoption grows, hyperscalers are becoming the primary platform through which these services are consumed, creating higher-value, stickier revenue streams than the bandwidth-centric business models that characterized the telecom era.

      While hyperscalers have increasingly issued debt and equity to fund capex, their financial position remains markedly different from that of many telecom infrastructure providers in the 1990s. Telecom operators often combined elevated debt burdens with deeply negative cash flow yields. Today, multiyear contracts and speedier revenue conversion underpin margins, with some projections pointing to rising free cash flow yields in 2027-28 despite ongoing capex growth.

      Regulatory uncertainty is yet another area where history offers useful perspective. The Telecommunications Act of 1996 deregulated the sector, opening competition to the local exchange carrier level and spurring investment. By 2000, however, a meaningful increase in competition had not arisen as implementation was bogged down in courts, deterring large-scale fiber-to-the-home investment, or “last mile” infrastructure, by local exchange carriers. The experience serves as a reminder that policy — energy availability, data privacy, AI regulation, export controls, or antitrust scrutiny — could alter the economics of AI infrastructure investment and slow the pace at which projected demand ultimately materializes.

      Finally, capex booms can span decades, eventually leading to new waves of investment or to the rise of competing technologies. After railroad track mileage peaked in 1916, there were successive waves of investment, such as westward extension and interurban rail. But it was the rise of competition from the automobile and interstate highway system that resulted in roughly 60% of peak mileage being abandoned by 2020. Today, investors may be underestimating future waves of investment, such as supporting infrastructure related to power plants and grid upgrades as well as the rise of robotics and automated driving. A downside risk is the possibility that future technological shifts improve compute efficiency or alter how AI is delivered.

      While no historical comparison is perfect, the current cycle differs from many past investment booms in several important respects: stronger demand, healthier balance sheets, and faster paths to monetization. At the same time, history reminds us that financial conditions, regulation, and technological change remain critical factors in determining how long even the most compelling investment cycles can endure.

        Two words that can ruin the economics of any industry are now being used in reference to large AI language models: price war. OpenAI is said to be considering drastically lowering the prices it charges users as it seeks to win customers from its rival Anthropic. If it does so, the more durable opportunity within AI may sit with the companies receiving the capital spending rather than the companies doing the spending.

        A useful way to view the AI industry is as a layer cake (Exhibit 6). At the top are applications and workflows; beneath them are models, data infrastructure, compute, and networking; and at the base are energy, hardware, manufacturing capacity, and materials.

        Exhibit 6: The AI Ecosystem Extends Beyond Applications and Models

        Key takeaway: Lasting value of AI likely comes from owning the layers closest to proprietary data, workflows, and customer relationships, not just the model itself.

        Lasting value of AI likely comes from owning the layers closest to proprietary data, workflows, and customer relationships, not just the model itself. -- activate to enhance object.

        Chart 6 — AI company deal network
        Alt text: Network diagram showing business relationships among OpenAI, Microsoft, Nvidia, CoreWeave, AMD, and Oracle. Colored arrows represent chip purchases, infrastructure purchases and rentals, equity investments, and revenue sharing. OpenAI and Microsoft have multiple reciprocal links, while Nvidia, CoreWeave, AMD, and Oracle are connected through chip supply, infrastructure rental, and investment relationships.

        As of March 10, 2026. Source: Jensen Huang, Nvidia CEO

        Investors naturally gravitate toward the top of the AI stack because it looks like the software world they know. But the constraints are moving lower. Software can be created and deployed quickly at scale; power plants, substations, transformers, semiconductor fabs, data centers, and grid connections cannot. With capital readily available, the binding constraint is becoming physical rather than financial. The gap between surging digital demand and slow-moving industrial supply is where bottlenecks are emerging — from gas turbines and advanced chips to IT components, permitting, and regulatory approvals. It is also where pricing power is most likely to appear, and where the pace of the AI buildout will ultimately be determined.

        All of this has helped kick-start a unique U.S. manufacturing cycle. The Institute for Supply Management (ISM) Manufacturing Purchasing Managers’ Index (PMI) reached 53.3 in June 2026, with new orders at 56.0 and production at 52.2, and manufacturing for employment demand beginning to improve. The ISM has also reported electrical components, memory, and semiconductors are in short supply. This supports the view that the AI cycle is beginning to spill into the industrial economy, though so far it falls short of a full reindustrialization. The reason is again due to bottlenecks. The U.S. faces a capital-stock problem: rebuilding factories, machine tools, skilled labor pools, and supply chains will take years, not quarters.

        The durability of the cycle will ultimately depend on whether AI adoption delivers meaningful productivity gains. As AI moves from a tool used by individuals to an operating layer used by the majority of companies, the benefit shifts from experimentation and learning to operating leverage. Software development and product cycles will shorten, and customer service can improve as costs fall and labor is redirected toward higher-value work. Even incremental productivity gains, if widely diffused, can meaningfully boost margins, capital formation, and real growth.

        Bessemer portfolio holdings span the AI layer cake with exposure to the inputs needed to scale and build out AI rather than depending on any single application or model. For investors, the key implication is that capitalization-weighted benchmarks are more reflective of the cycle’s early winners than the companies best positioned for the next phase. In Bessemer’s view, the companies that own scarce capacity, have pricing power, benefit from longer order books, and can convert demand into free cash flow will be the winners. The bull case will rest with those who can take advantage of the bottlenecks rather than those simply exposed to the broader theme.

        Spotlight: Bottlenecks in Networking Creating Opportunities

        Networking is becoming more critical to the development of frontier model intelligence. Moore’s Law is slowing, which means individual chip improvements through transistor shrinkage are slowing. Further advances in frontier models require greater computing power, making other approaches to improving performance increasingly important. Connecting chips together more efficiently is becoming a more important source of computing power. Training and inferencing clusters — the large networks of chips used to build AI models and deliver AI services to users — continue to grow in size, increasing the importance of networking infrastructure.

        As a result of these trends, we believe networking should grow faster than computing power for the foreseeable future, aided by the compounding effect. Each incremental accelerator added to a cluster generates traffic in a superlinear way — that is, the ratio of switches to accelerators goes up faster than 1:1. For 32 accelerators, you only need 12 switches. For 128 accelerators, you need 80 switches.

        In addition, faster networking requires more expensive switches, providing a tailwind to pricing. Third-party estimates project AI networking spend to reach $200 to $250 billion by 2030, up from $50 billion today. The Bessemer equity teams have exposure to networking through positions in Broadcom (AVGO), Nvidia (NVDA), and Cisco (CSCO).

        Within networking, there are three primary categories: scale-across, which connects data centers; scale-out, which connects server racks within data centers; and scale-up, which connects accelerators within server racks. In scale-up, copper has been the default due to its reliability, cost, and power efficiency, but it is not ideal for longer distances or higher speeds due to physical limitations. Once you go beyond a certain distance and/or bandwidth/latency requirement, optical connectivity becomes increasingly necessary. Bessemer believes this shift toward optical connectivity will be an increasingly important trend over time. The equity teams have exposure to this trend through companies such as Applied Optoelectronics (AAOI), Credo (CRDO), and MACOM Technology (MTSI).
          History suggests that even when a technology delivers on its promise, the path for investors can be far less rewarding if capital deployment runs ahead of economic reality. We are monitoring several key risks that warrant close attention.

          Overestimated Revenue

          Perhaps the largest risk facing the AI investment cycle is that future revenue fails to meet today’s expectations. A significant portion of projected infrastructure spending is tied to assumptions about the future growth of companies competing for market share. OpenAI alone accounts for infrastructure commitments totaling $600 billion through 2030. To justify these lofty commitments, OpenAI is projecting annual revenues to reach $280 billion by 2030, a significant increase from the $13 billion in annual revenues in 2025.

          The winners may be the companies that own scarce capacity, have pricing power, and convert demand into free cash flow.

          Revenue is expected to be generated by a mix of business customers and individual users. However, even under reasonable pricing assumptions, achieving those revenue levels would require hundreds of millions of paying users. Given estimates of a global addressable market of roughly 700 million AI tool users by 2030,¹ it is likely that companies would need to charge thousands of dollars per customer to justify their investments and maintain their valuations.

          However, there are a few ways for AI companies to overcome these challenges. If AI models achieve enough specialization in different use cases, customers may feel justified maintaining multiple subscriptions simultaneously. Also, if companies are able to successfully incorporate paid advertising into their user interfaces, then they would need less subscription revenue to support the same valuations.

          Cheaper Models and Technological Disruption

          Much of the industry’s investment thesis is based on extrapolating from a period of extraordinary model development into a future where AI demand is ubiquitous and customer market share is dominated by the most advanced models. However, technological breakthroughs could challenge that assumption. More efficient models could dramatically reduce the cost of delivering AI services.

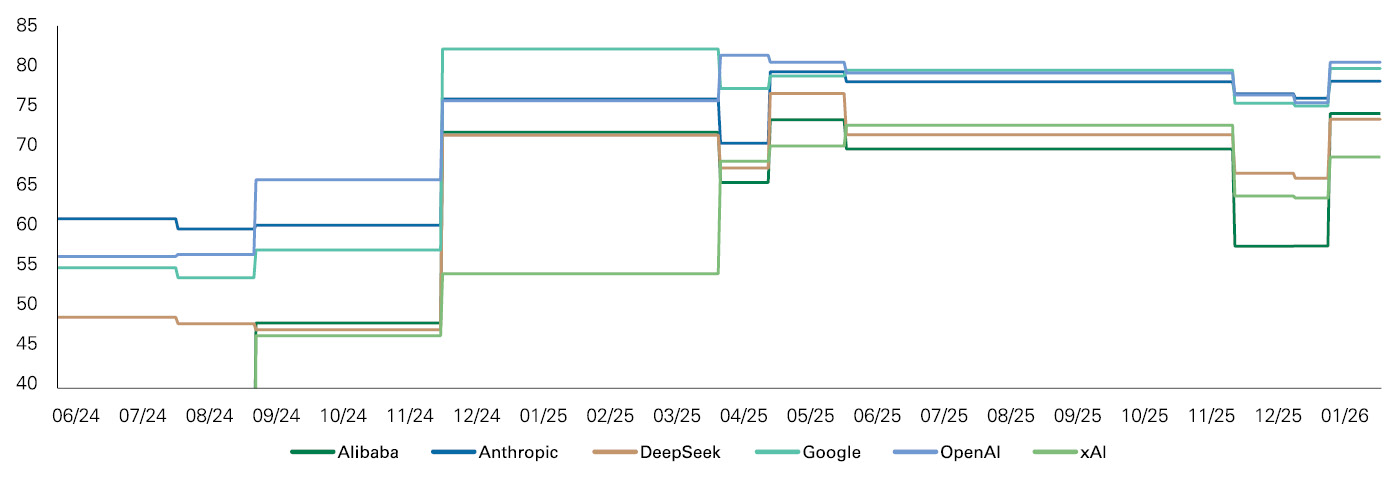
          For example, DeepSeek-V3 achieved performance comparable to leading closed-source models while using only 10% to 20% of the GPU training hours and less advanced chips. More recently, Chinese models have been moving closer to parity with major U.S. models on key benchmark tests (Exhibit 7). As a result, the frontier of AI development may turn out to be less compute-dependent than the current capex cycle assumes.

          Exhibit 7: Overall Benchmark Scores of Leading LLM Models

          Key takeaway: Chinese AI LLMs are close behind the best American models on key benchmark tests.

          Chinese AI LLMs are close behind the best American models on key benchmark tests. -- activate to enhance object.

          Exhibit 7: Overall Benchmark Scores of Leading LLM Models
          Key Takeaway: Chinese AI LLMs are close behind the best American models on key benchmark tests.
          As of January 8, 2026. Chinese models (Alibaba, DeepSeek) vs. U.S. models (Anthropic, Google, OpenAI, xAI). Source: Livebench.ai
           

          As of January 8, 2026. Chinese models (Alibaba, DeepSeek) vs. U.S. models (Anthropic, Google, OpenAI, xAI). Source: Livebench.ai

          If Chinese or open-source AI models remain significantly cheaper to train while staying within roughly 5% to 10% of the best U.S. models on commercially relevant tasks — such as coding, reasoning, language translation, and agentic workflows — buyers could increasingly route workloads to cheaper models. At that point, the need for AI infrastructure investment would not be eliminated, but demand for the most aggressive GPU and data-center investments could be significantly scaled back.

          Circular Financing

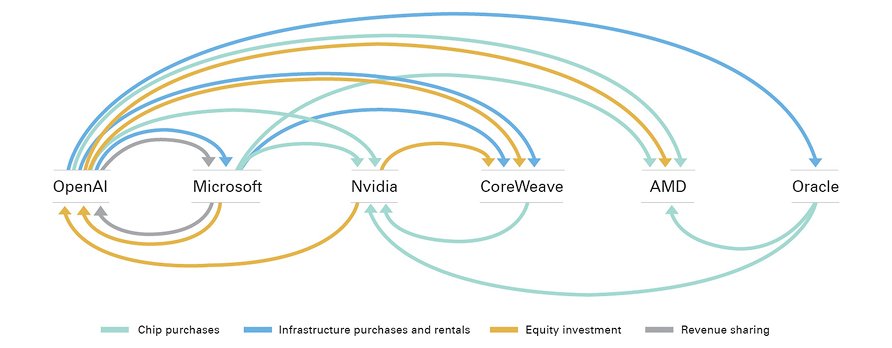
          We are also monitoring the increasingly interconnected nature of AI industry transactions. Many of the largest deals announced to date involve companies investing in one another, entering long-term supply agreements, or exchanging equity incentives (Exhibit 8). As a result, some investors have questioned whether a portion of the industry’s projected growth is circular.

          Exhibit 8: Mapping the Interconnection Risks in AI

          Key takeaway: AI revenues and investment commitments are becoming increasingly interconnected.

          AI revenues and investment commitments are becoming increasingly interconnected. -- activate to enhance object.

          Exhibit 8: Mapping the Interconnection Risks in AI
          AI revenues and investment commitments are becoming increasingly interconnected.
          As of October 8, 2025. Source: WSJ/Morgan Stanley

          As of October 8, 2025. Source: WSJ/Morgan Stanley

          For example, Nvidia recently announced a $100 billion investment in OpenAI. The investment is intended to support OpenAI’s infrastructure expansion, including purchases of Nvidia hardware. In effect, Nvidia is investing capital into a customer that will subsequently spend a portion of that capital purchasing Nvidia products.

          At moderate levels, these transactions may be strategically sound, but they also increase the risk of companies becoming too financially intertwined. Excessive vendor financing arrangements were a contributing cause of the boom and bust of the telecommunications industry in the late 1990s.

          Underestimated Costs

          While much of the discussion surrounding AI focuses on future revenue opportunities, the cost side of the equation may also prove more challenging than expected. Demand for advanced semiconductors, electricity, networking equipment, cooling systems, and specialized construction services continues to increase. If these inputs become more expensive, the economics of AI projects may deteriorate even if current demand forecasts are met.

          Another consideration is the useful life of AI hardware, such as semiconductors, where the pace of acceleration may render equipment economically obsolete much sooner than anticipated. Nvidia, for example, has introduced new chips each year, often delivering significant performance improvements from one generation to the next. This could increase the amount of ongoing spending required to maintain competitiveness.

          Power and Infrastructure Constraints

          In addition to generation capacity, the industry depends on transmission infrastructure, transformers, switchgear, substations, cooling systems, and water resources. Many of these components are already experiencing supply constraints.

          There is a growing possibility that companies could race to build data centers faster than they can secure the infrastructure necessary to operate them. In such a scenario, billions of dollars could be invested into facilities that remain underutilized while waiting for grid connections or supporting infrastructure upgrades. Some data centers are already sourcing their own power to avoid bottlenecks and constraints associated with the existing power grid.

          Public Opposition

          Polling suggests many communities remain skeptical of large data center developments due to concerns about electricity consumption, water usage, noise, environmental impact, and land use. It would not be surprising to see municipalities reject, delay, or impose additional restrictions on future data center projects. As the scale of AI infrastructure grows, obtaining public support may become an increasingly important factor in determining where and how projects are built.

          Regulatory Risk

          Today, there are relatively few restrictions governing how AI models are trained, deployed, or commercialized. However, governments around the world are actively evaluating issues related to privacy, intellectual property, national security, misinformation, and labor displacement.

          A more restrictive regulatory environment could alter the economics of AI development. New compliance requirements, limits on model capabilities, restrictions on data usage, or increased liability standards could reduce profitability and lower the expected returns from infrastructure investments.

          Regulatory risk extends beyond AI models themselves and may increasingly affect the physical infrastructure that supports them. Restrictions on electricity consumption and water usage, for example, could slow the pace of data center development.

          Financial Conditions

          The AI investment cycle is also increasingly dependent on favorable capital market conditions. Part of what made mega-cap technology firms so attractive to investors over the past several years was their ability to generate free cash flow and remain asset-light. Today, many are directing that cash toward AI infrastructure while simultaneously raising additional capital through debt and equity markets.

          This dependence introduces a new set of risks. If interest rates rise, financing costs increase. If equity markets decline, valuations fall, and issuing shares becomes more dilutive. If credit spreads widen, debt financing becomes more expensive or less available. As a result, deteriorating market conditions could force management teams to reassess spending plans and prioritize financial discipline over growth.

            The AI capex cycle is often referred to as either the next great productivity revolution or another speculative investment boom waiting to unwind. Currently, it is a robust investment cycle with tangible economic benefits, though with constraints and risks. The path will not be determined by AI alone. Macroeconomic conditions, power availability, regulation, enterprise adoption, and management discipline will all shape how the cycle develops.

            History suggests that productive investment booms create lasting economic value, even when the market path is not linear. The key question is not whether AI is a bubble or a revolution, but how much of today’s investment will translate into sustainable revenue and broad productivity gains. As the buildout evolves, opportunities may emerge not only among the companies developing AI applications, but also among those providing the infrastructure, networking, power, and other inputs needed to support growing demand.

            In Bessemer’s portfolios, we must strike the proper balance. We remain mindful that some of today’s winners are benefiting more from temporary supply and demand imbalances that don’t necessarily translate into long-term, durable competitive moats. Periods of rapid change can obscure the difference between businesses with true advantages from those simply benefiting from less durable trends. Leaving the latter out of portfolios can cause a certain degree of pain in the very near term, but patience will matter more and more as this cycle matures.

            The answers will become clearer over time. For now, the evidence suggests the AI investment cycle remains supported by strong fundamentals, even as we continue to monitor the factors most likely to determine its long-term durability.

            We thank Brittany Baumann, Joseph Clay, Kyle Concannon, Calvin Huang, Samuel Park and Tom Wicks for their or their contributions.

              Past performance is no guarantee of future results. This material is provided for your general information. It does not take into account the particular investment objectives, financial situations, or needs of individual clients. This material has been prepared based on information that Bessemer Trust believes to be reliable, but Bessemer makes no representation or warranty with respect to the accuracy or completeness of such information. This presentation does not include a complete description of any portfolio mentioned herein and is not an offer to sell any securities. Investors should carefully consider the investment objectives, risks, charges, and expenses of each fund or portfolio before investing. Views expressed herein are current only as of the date indicated, and are subject to change without notice. Forecasts may not be realized due to a variety of factors, including changes in economic growth, corporate profitability, geopolitical conditions, and inflation. The mention of a particular security is not intended to represent a stock-specific or other investment recommendation, and our view of these holdings may change at any time based on stock price movements, new research conclusions, or changes in risk preference. Index information is included herein to show the general trend in the securities markets during the periods indicated and is not intended to imply that any referenced portfolio is similar to the indexes in either composition or volatility. Index returns are not an exact representation of any particular investment, as you cannot invest directly in an index. Alternative investments, including private equity, real assets, and hedge funds, are not suitable for all clients and are available only to qualified investors.