Politics, Policy, and Markets:
Short- and Long-Term Implications
- Today, markets are grappling with a host of political issues at home and abroad including the Israel-Hamas war, ongoing U.S.-China tensions, a rapidly growing national debt, a possible government shutdown, the looming presidential election, and more.
- Ultimately, financial markets are driven by corporate and economic fundamentals, but politics can have an outsized impact in the short term.
- In this Investment Insights, we examine the current U.S. policy backdrop, the growing U.S. debt and interest burden, and the upcoming election, as well as their implications for portfolio positioning.
The U.S. political climate is squarely in focus, and markets are trying to digest and understand a range of political issues:
- The continuing battles over spending priorities and government funding, including the ongoing threat of a government shutdown.
- $33 trillion of national debt, which is expected to grow. The government continues to spend more than it receives in tax revenue. Congressional Budget Office projections indicate the situation is likely to get worse, not better.
- Rising interest on federal debt given higher interest rates. Interest expense is now 14% of tax revenue.
- The upcoming 2024 election, which looks likely to see a rematch of two statistically unfavorable candidates amid a political backdrop characterized by a bitterly divided population.
Politics can often loom large in the short run, but the stock market has proven surprisingly resilient, often moving higher regardless of perceived political turmoil. Over the long run, financial markets tend to be much more influenced by corporate earnings, interest rates, inflation, valuations, and the overall health of the global economy.
Although this Investment Insights focuses primarily on U.S. politics, we continue to monitor a myriad of other issues, including the Israel-Hamas and Ukraine-Russia wars, and ongoing geopolitical tensions between the U.S. and China in the context of the outlook for the global economy, inflation, and the Fed.
The Current Policy Backdrop
The October 7 terrorist attacks on Israel affected the global geopolitical landscape and political dynamics in Washington. The current situation in the Middle East has brought a renewed focus on national security and placed additional pressure on Congressional action now that the House leadership issue has been solved and government shutdown risk is postponed until early 2024. While both sides seem committed to supporting additional funds for Israel, they are much more divided on Ukraine support and border funding.
Government shutdowns: usually not a significant event for financial markets
The U.S. federal government is forced to shut down when Congress fails to pass legislation required to fund the government. Without approved spending, federal agencies must cease all nonessential functions until Congress acts. Currently, a continuing resolution, or temporary funding package, bridges the government’s operations through early 2024. While time remains for Congress to reach a resolution to avoid a shutdown in the new year, a shutdown remains a possible outcome. Still, it is important to note that even in the event of a government shutdown, the odds of a prolonged shutdown lasting more than two to three weeks remain low given the likely costly political consequences, such as not paying service members. Historically, government shutdowns have lasted an average of eight days (Exhibit 1), and market impact has been limited. In fact, on average, equity markets have risen 2% during the last five government shutdowns. In the past, markets have correctly assumed that government shutdowns have been more political theatre than real market-moving, seismic events.
Exhibit 1: Duration of Government Shutdowns
Key takeaway: Government shutdowns historically have had an average duration of eight days.
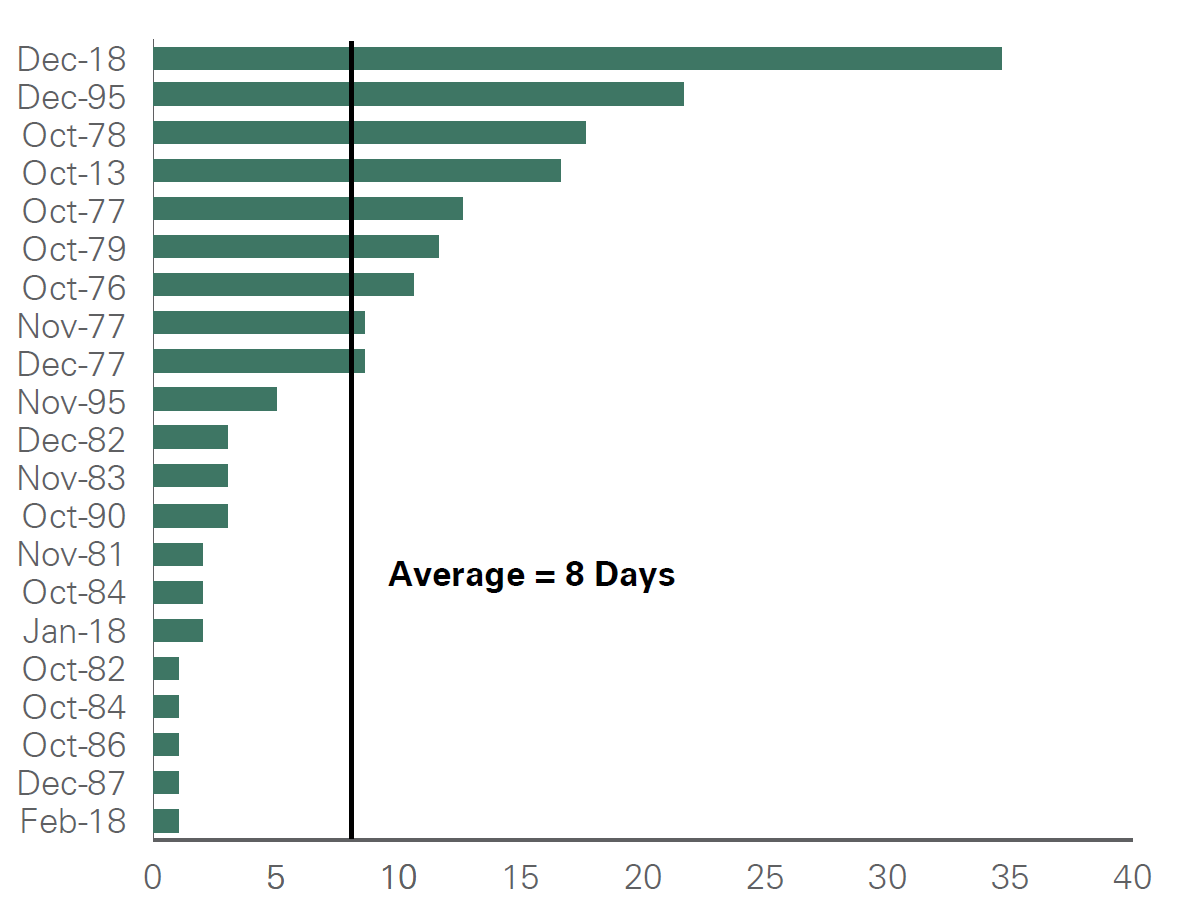
A chart illustrating the completed lengths, in days, of historic U.S. federal government shutdowns, with an average duration of eight days. The exhibit highlights that shutdowns tend to be relatively short-lived and have typically had limited impact on broad financial markets, supporting the commentary that political theater often outweighs long-term economic disruption.
Source: New York Times
Defense package: funding for Israel and Ukraine remains uncertain
The nature of any short-term defense spending bill is still unclear at this point. Priorities include funding for Israel, Ukraine, and U.S. border security and broader defense. The Biden administration released a $106 billion package consisting of aid to Israel, Ukraine, and Taiwan, alongside additional funds for the border. However, Congress is quite far from the president’s plan; funding for Israel is being held as Republicans tied the deal to spending cuts that Democrats oppose, and Ukraine aid has met resistance as Republicans are demanding real border security reforms as a condition for any additional money for Ukraine. Under the debt ceiling bill passed on May 31, 2023, the base defense budget is set to increase more than 3%; however, Congress still needs to pass full-year appropriations for defense spending to avoid the same 1% cut next year that will hit discretionary spending.
Broader legislation: unlikely to see significant progress before the election
Beyond some compromise on defense spending, which we see as a question mark but still more likely than not, especially for Israel, we expect broader legislation to be at a standstill given the hostile political environment and nearing election season. While there is a long list of legislative initiatives on political wish lists that investors are monitoring — including taxes, cannabis, pharmacy pricing, energy permitting reforms, credit card competition, and stablecoin regulation — the closer we get to election season, the less likely we are to see any real legislative activity.
Fiscal policy: the shift from consumer to industrial
The pandemic support to consumers is now largely in the rearview mirror, even though U.S. consumers in aggregate still have about $400 billion in excess savings remaining from various stimulus provisions and pandemic savings. However, new fiscal incentives are coming related to industrial policy over the next several years, which will be a partial offset for the U.S. economy as the consumer stimulus rolls off (Exhibit 2).
Infrastructure spending is just getting started — the 2021 bipartisan Infrastructure Investment and Jobs Act (IIJA) included $415 billion in gross new discretionary funding over prior highway bills, and the expected spending from this legislation does not peak until 2026. We believe that the full impact of the Inflation Reduction Act (IRA), IIJA, and CHIPS Act is not fully appreciated by the markets for a few reasons:
- Slow ramp-up: Spending on all three bills will more than double from 2023 to $87 billion in 2024.
- Scale: The IRA is running over 50% above initial estimates of more than $660 billion over 10 years — we think this will have to be seen to be fully believed.
- Elevated policy uncertainty: Companies are still seeking clarity regarding how these tax credits will work, and tracking implementation from a top-down perspective has proven challenging. Resolving this uncertainty could be a positive catalyst for business investment and the financial markets.
Exhibit 2: Infrastructure Discretionary Spending Increasing
Key takeaway: As pandemic consumer aid rolls off, new fiscal incentives are coming from U.S. industrial policy.
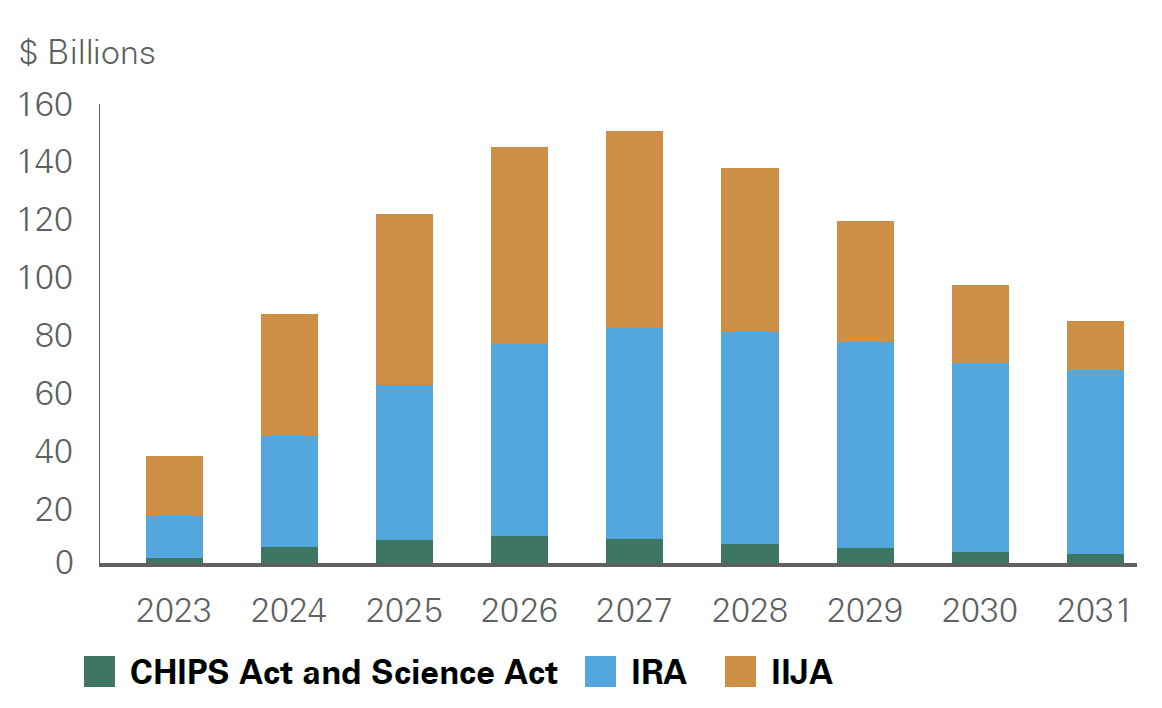
A visual representation of U.S. infrastructure discretionary spending over recent years, showing that pandemic-era consumer stimulus is receding while industrial policy funding — including infrastructure, clean energy incentives, and semiconductor production assistance — is ramping up. This exhibit underscores fiscal transitions from short-term stimulus toward longer-term growth investments.
Source: Estimates from the Congressional Budget Office, Joint Committee on Taxation
The Growing U.S. Debt and Interest Burden
Over the last 50 years, the U.S. has consistently spent more than it has received in tax revenue (Exhibit 3). As a result, it has built a significant debt burden. Looking at the estimates from the Congressional Budget Office (CBO), the U.S. debt problem looks likely to get worse, not better, as Americans age and social security and healthcare expenses rise.
When interest rates were very low, the U.S. budget deficit was not portrayed as a problem by many politicians. As long as the economy was growing by more than the cost of debt, most advocated in favor of deficit spending. But unfortunately, the U.S. didn’t lock in much longer-term debt at lower rates. In fact, the U.S. has over $7.6 trillion maturing over the next year alone. As this debt is refinanced at higher rates, the interest cost on the debt is set to march higher. Given the recent rise in interest rates, U.S. interest expense has seen its first increase in 35 years.
Exhibit 3: U.S. Government Outlays and Revenues
Key takeaway: The U.S. deficit has risen over the past 50 years and is set to increase further.
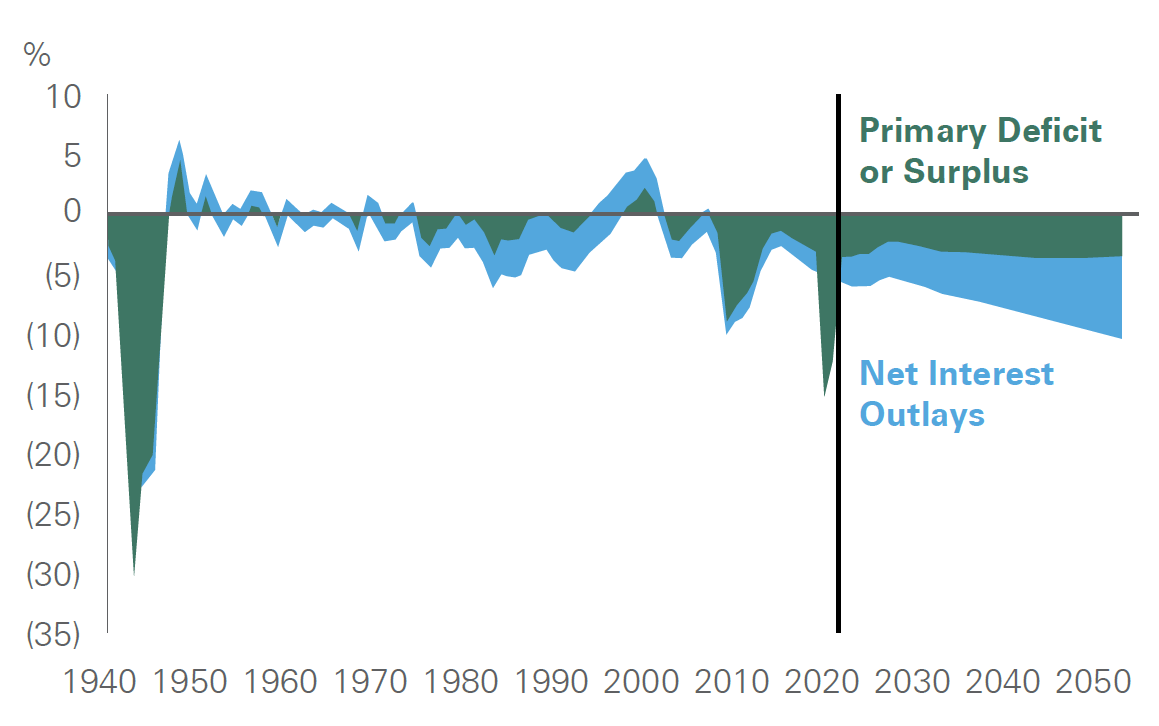
A long-term chart depicting the divergence between U.S. government outlays and federal revenues over the past five decades, illustrating a structural rise in deficits that contributes to growing national debt and fiscal stresses. The chart is used to explain how rising deficits and interest costs are likely to shape future economic and political debates.
Source: Congressional Budget Office
The rise in long-term interest rates combined with widening deficits and heightened fiscal discord in Congress has renewed questions about the sustainability of rising government interest costs. Given signs of divergence between bond yields and growth expectations, political concerns are likely impacting bond yields, as evidenced by an increase in the term premium, or extra yield that investors are demanding in order to lock up their money for longer periods. While the borrowing trends of the U.S. government are concerning from a longer-term perspective, we believe the U.S. funding cost risk is well mitigated by the critical and central roles of the U.S. dollar and Treasury market within the global financial system. Even though supply and demand imbalances in the Treasury market have been one factor impacting the term premium, the outlook for the economy and Fed policy remains the most important driver of yields, in our view. We note that over long periods of time, rising deficits and yield levels do not have a strong correlation.
Ultimately, more debt could mean higher future taxes or less government spending — or both. Said another way, we are likely to see increased fiscal austerity. When net interest costs as a percentage of tax revenue are greater than 14%, historically, Washington has moved from fiscal stimulus to austerity (Exhibit 4). The 14% threshold has been hit this year.
Exhibit 4: Interest Costs and Fiscal Austerity or Stimulus
Key takeaway: Key Takeaway: Higher net interest costs have historically led to fiscal austerity.
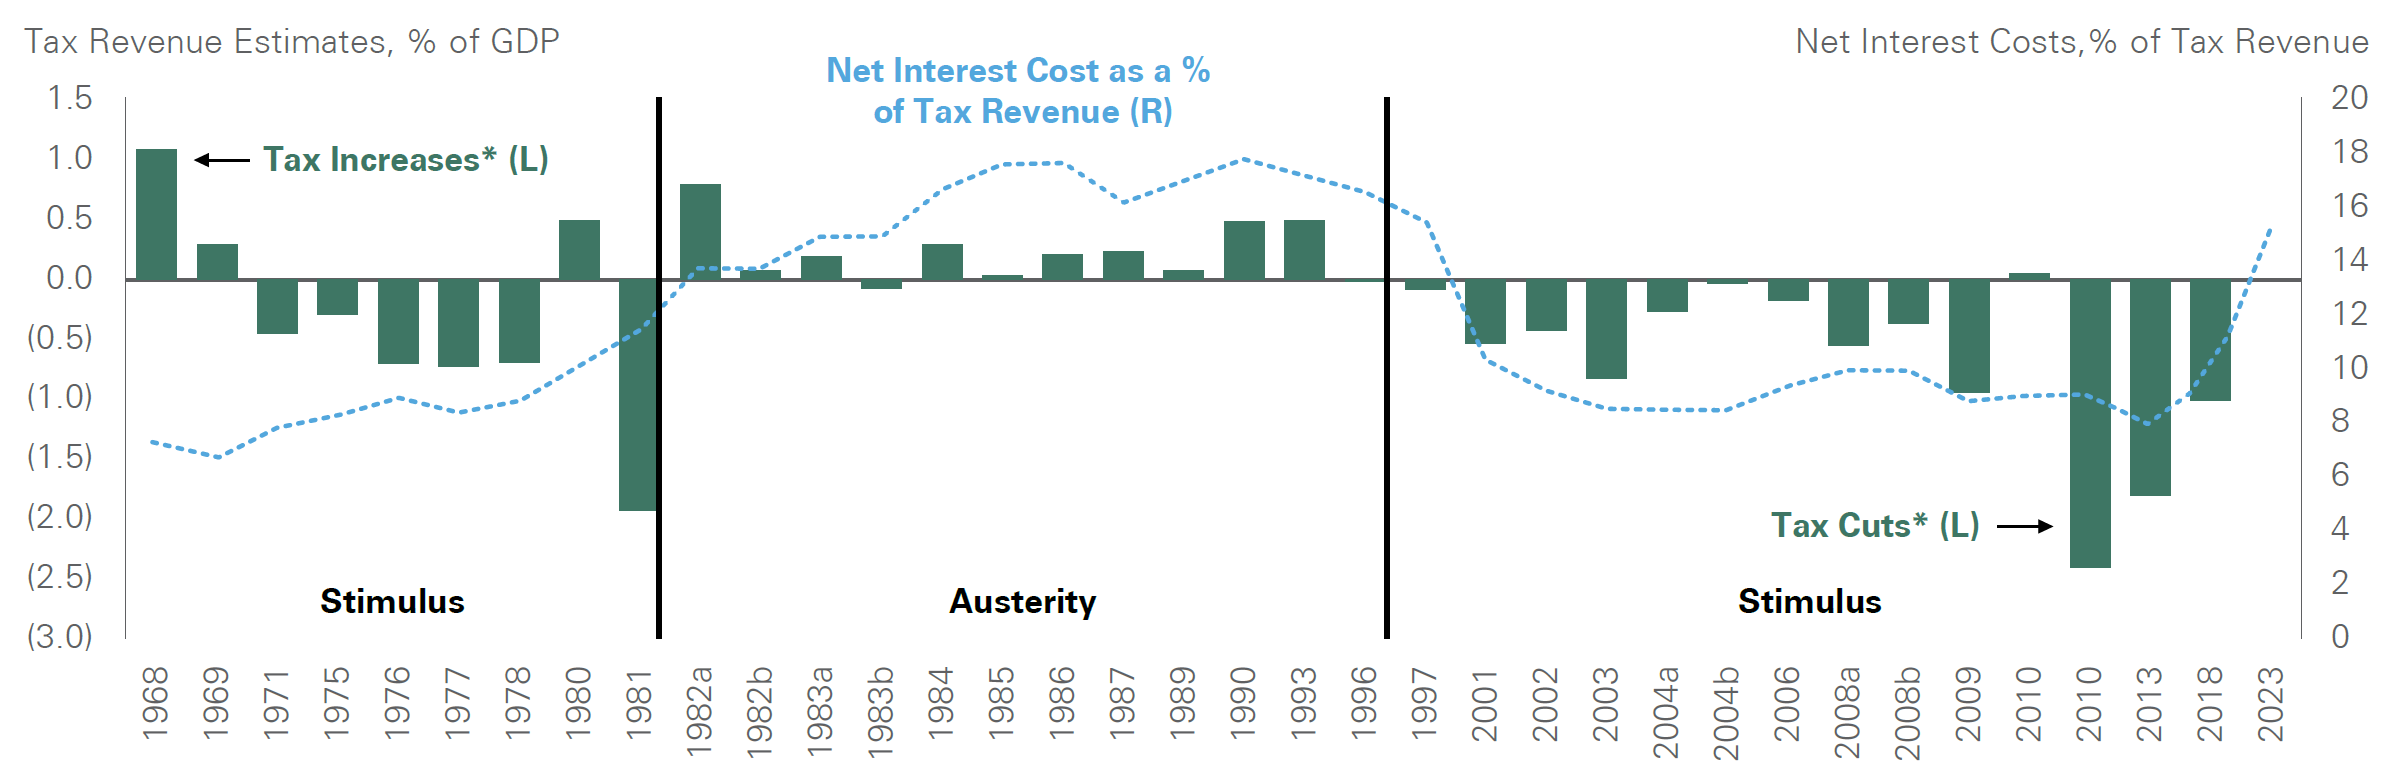
A chart comparing U.S. net interest costs as a share of tax revenue against historical fiscal policy stance, illustrating that when interest costs exceed a certain threshold (around 14% of tax revenue), periods of fiscal austerity tend to emerge. This visual supports the narrative on long-term fiscal dynamics and how rising interest burden may influence future policy choices.
Source: Strategas Research Partners
Interestingly, fiscal austerity hasn’t necessarily been bad for the equity markets. To the extent that fiscal austerity helps contribute to an otherwise slowing economy, slower growth may push the Fed to lower interest rates sooner than it otherwise might have (Exhibit 5). Given the stock market’s negative reaction to higher short-term rates, lower short-term rates are likely to be seen in a positive light, absent a severe recession.
Exhibit 5: Days From Last Fed Hike to First Fed Cut
Key takeaway: Key Takeaway: The Fed has been more likely to cut rates when debt interest expense is high.
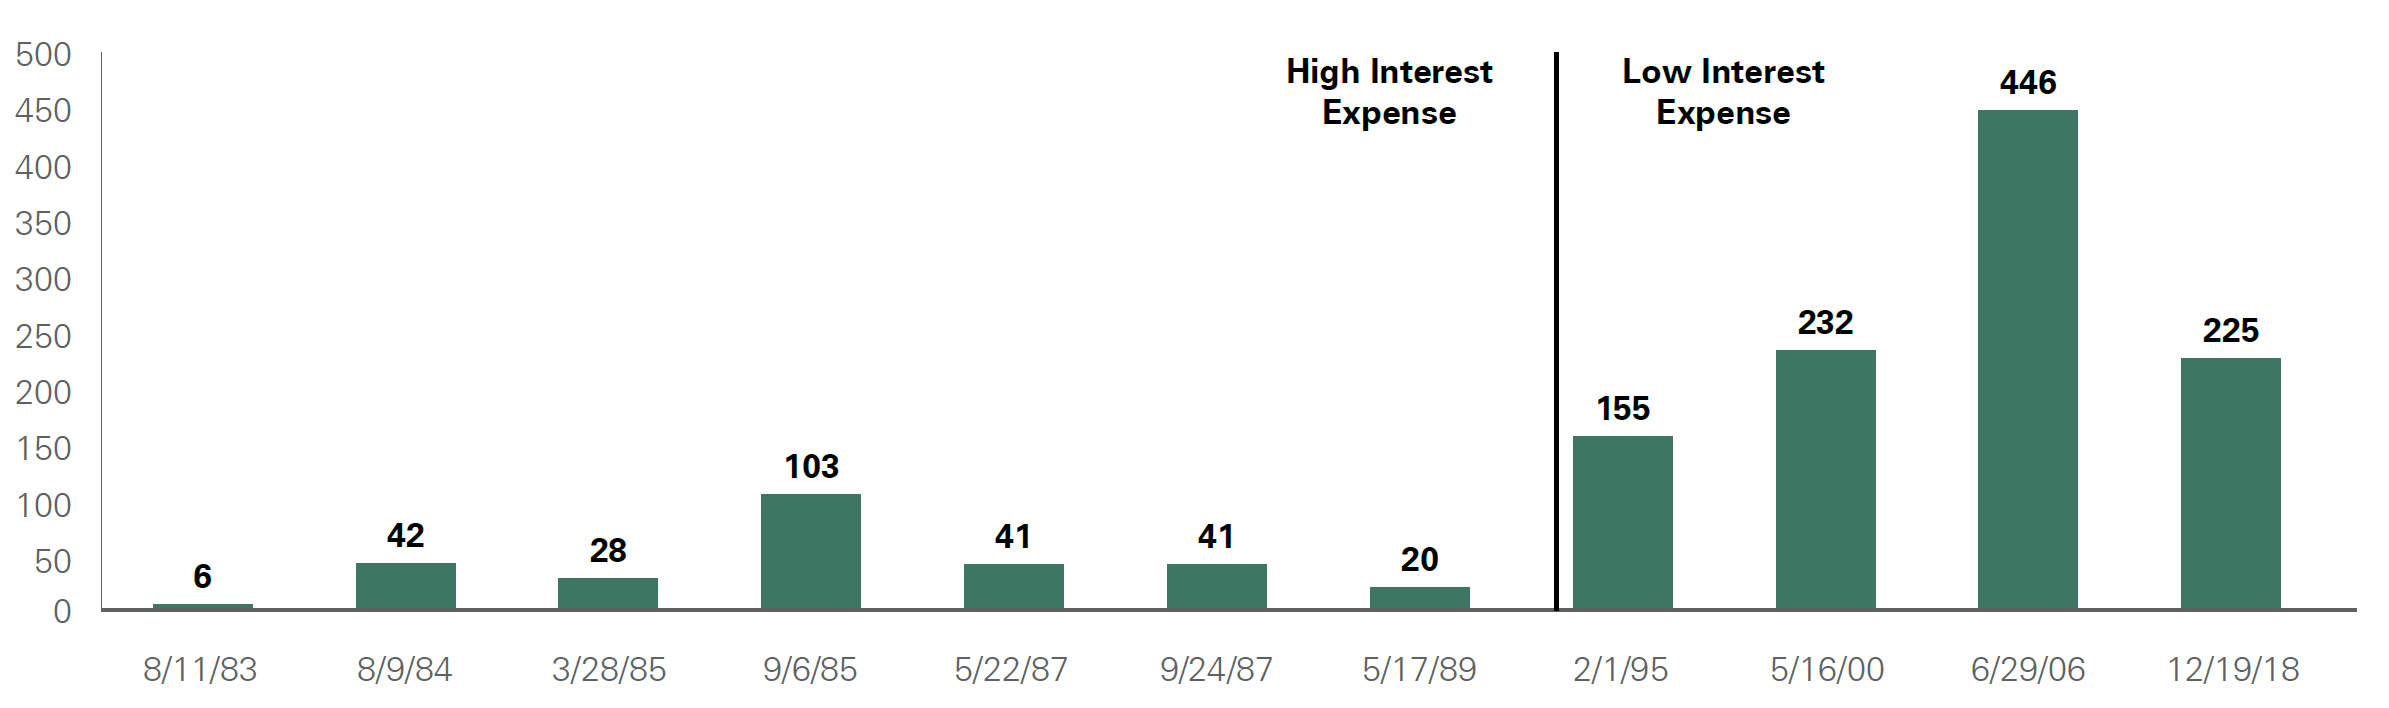
A chart showing historical intervals (in days) from the Federal Reserve’s last interest-rate hike to the first rate cut, segmented by whether interest cost burdens were high or low. The exhibit illustrates that higher interest expense regimes tend to result in earlier Fed easing, which is relevant to understanding monetary policy responses amid fiscal and political pressures.
Source: Strategas Research Partners
Election Season Is Just Around the Corner
Normally, presidential elections and cycles are not the primary factors driving the equity markets. Congress controls the purse strings, and even if the president were to have both chambers of Congress, 60 votes are needed in the Senate to bypass a filibuster. Yet, the political climate today is unique. The Republican and Democratic parties are staunchly opposed on priorities, and recent presidents have utilized executive orders more than ever before. Politicians have also relied heavily on reconciliation bills in the Senate to pass big fiscal policy changes with only a majority, as opposed to the 60 votes they would normally need.
While a lot could change as the next U.S. presidential election is roughly a year away, a Trump-Biden rematch appears likely, barring a health issue for either candidate (President Biden is 81 years old, and Donald Trump is 77). Even though current polling suggests Trump remains the Republican frontrunner, we keep in mind that the Iowa caucus has proven to be a turning point in the past, and it has the potential to propel another Republican candidate, such as Nikki Haley or Ron DeSantis. Should a Trump-Biden rematch occur, it would be the first time since 1912 that a current and former president have faced each other in the general election. Right now, the betting odds narrowly favor former President Trump to win on November 5, 2024, but it is early, and results could swing in another direction. It’s helpful to remember that the betting odds of Trump winning were 25% when he won and 40% when he lost.
Interestingly, both candidates remain fairly unpopular, each with a negative net favorability rating. This dynamic can increase the appeal of a third-party candidate — something that hasn’t had a notable impact on a presidential election since Ross Perot in 1992. While it is very difficult for a third-party candidate to win, the addition can dramatically change the election dynamics and ultimately spoil the victory for one party.
How important is the U.S. economy to the election outcome?
The economy and inflation are likely to be top issues in the election. While the rate of inflation is moderating, the absolute level of prices remains high relative to 2019, and many voters have expressed disappointment in “Bidenomics” with polls currently favoring Republicans on the economy. The trajectory of the economy over the coming year is incredibly important for the electoral outcome. Prior elections have shown that economic data late in the year before the election and early in the election year have a strong influence over the vote. Every president who has avoided a recession during the last two years of his first term has won reelection, and every president who oversaw a recession during those years lost reelection (Exhibit 6).
Exhibit 6: Recession and Presidential Reelections
Key takeaway: Recessions have a large impact on presidential reelection outcomes.
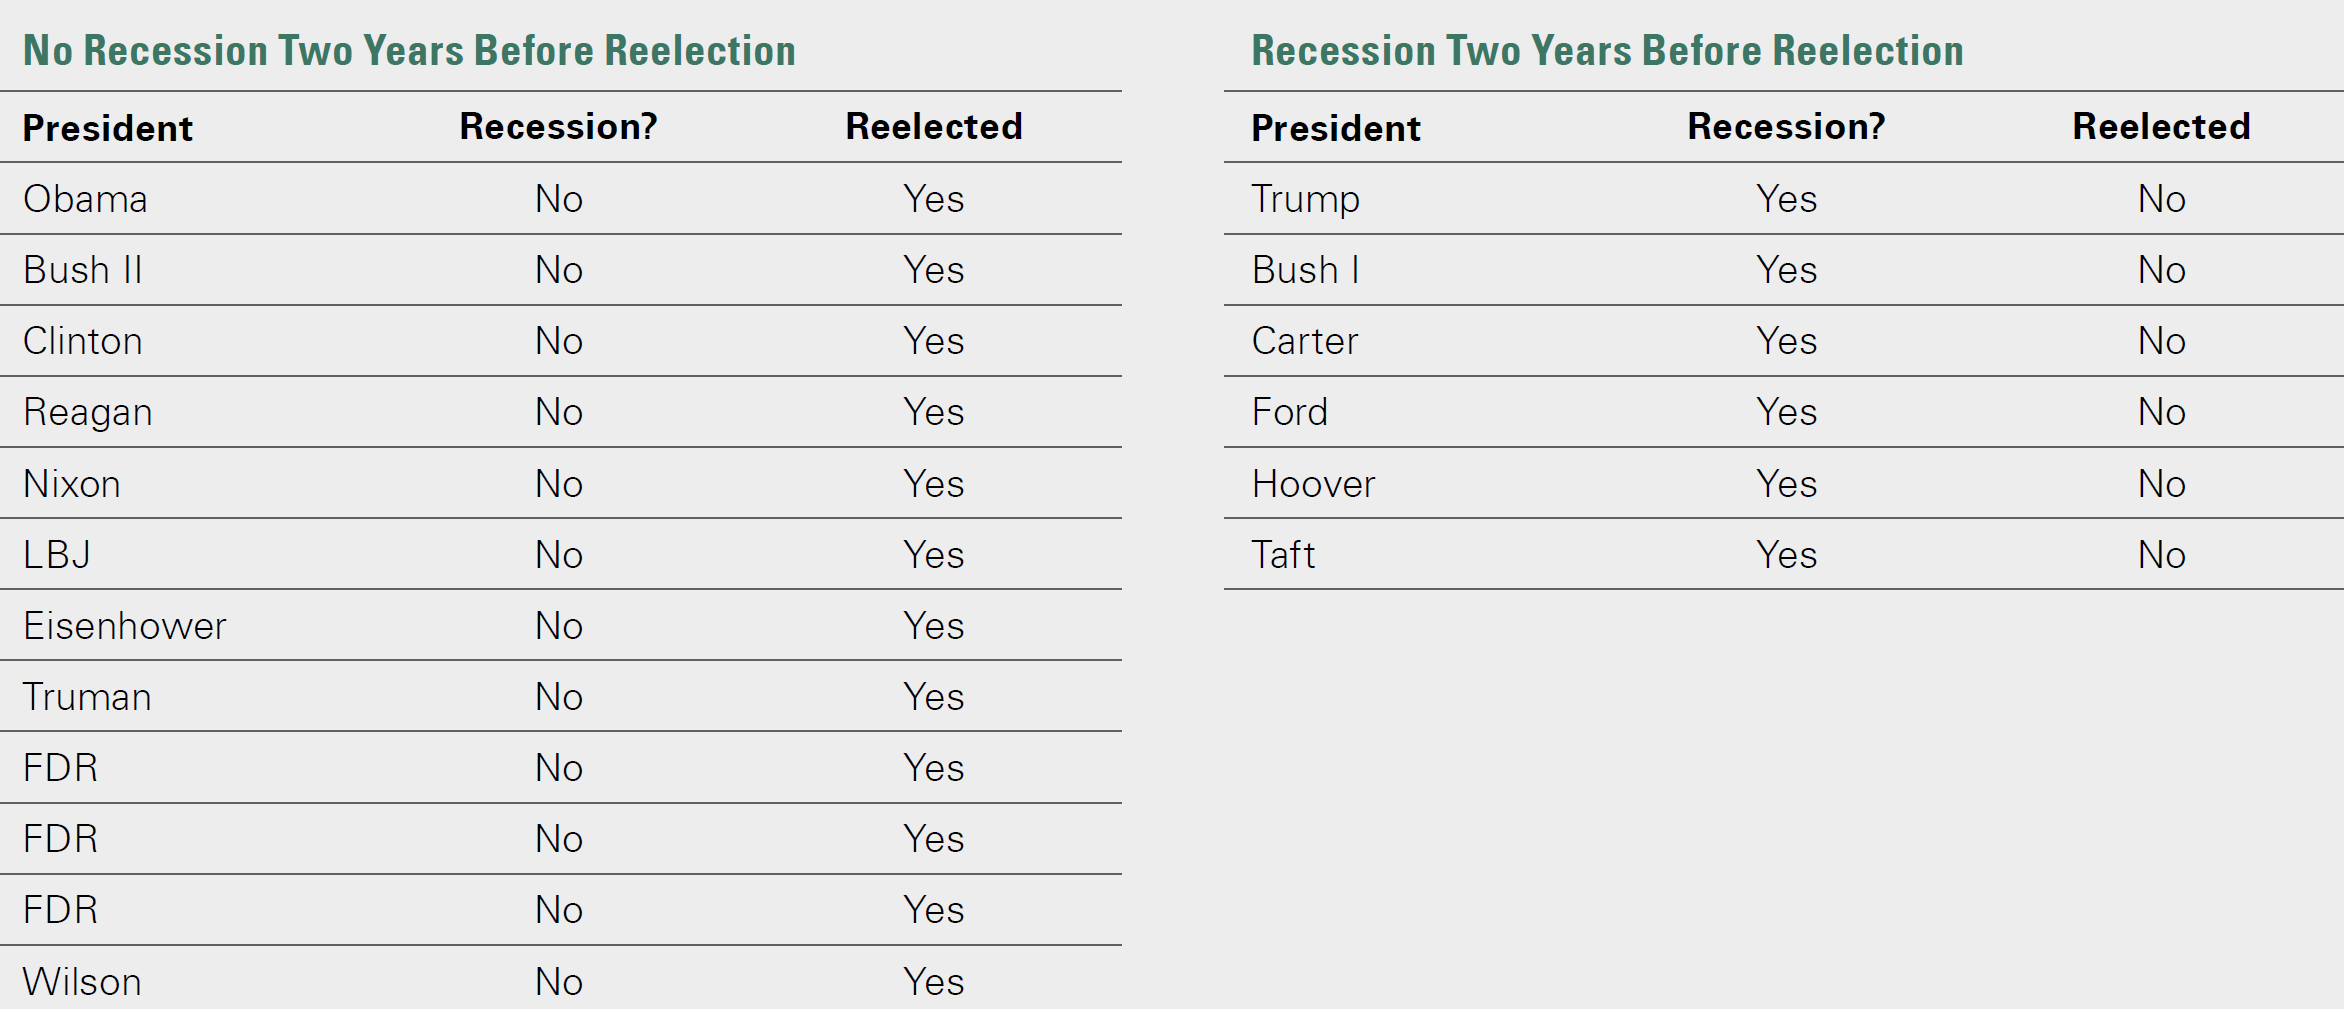
A chart showing how U.S. presidential reelection outcomes have been historically influenced by recession status, indicating that presidents who avoid recessions during the two years before an election tend to win reelection while those who oversee recessions tend to lose. This supports the narrative about the economic environment’s impact on electoral prospects.
Source: Strategas Research Partners
Additionally, it is possible that foreign policy could play an increased role in this election given heightened geopolitical tensions, including conflict in the Middle East, the ongoing Ukraine-Russia war, and a strained relationship between the U.S. and China.
While a Biden victory could look a lot like the last three years, were Trump to win, it’s unclear whether he would be more traditional (as he was in his first two years) or more unconventional (as he was in his last two years). He could pull the U.S. out of the World Trade Organization (WTO) or even North Atlantic Treaty Organization (NATO), and he would likely advocate for higher import taxes more broadly. Trump could also look to pull back U.S. financial and military support for Ukraine, exit the Paris Climate Accords, and reverse electric vehicle (EV) subsidies under Biden’s Inflation Reduction Act. Trump would also probably try to make the income tax cuts he signed into law in 2017 permanent (the provisions are set to expire on December 31, 2025).
Despite rising polarization, the U.S. stock market has been incredibly resilient over time. Corporate earnings have risen, and stock prices have followed, regardless of the leadership in the White House (see Exhibit 7). While U.S. politics could have a short-term impact on financial markets, over the long run, earnings, interest rates, inflation, and the health of the global economy will be more important drivers.
Exhibit 7: Growth of $100 in the S&P 500 (1960-2023)
Key takeaway: The stock market has tended to rise over time, regardless of the political environment.
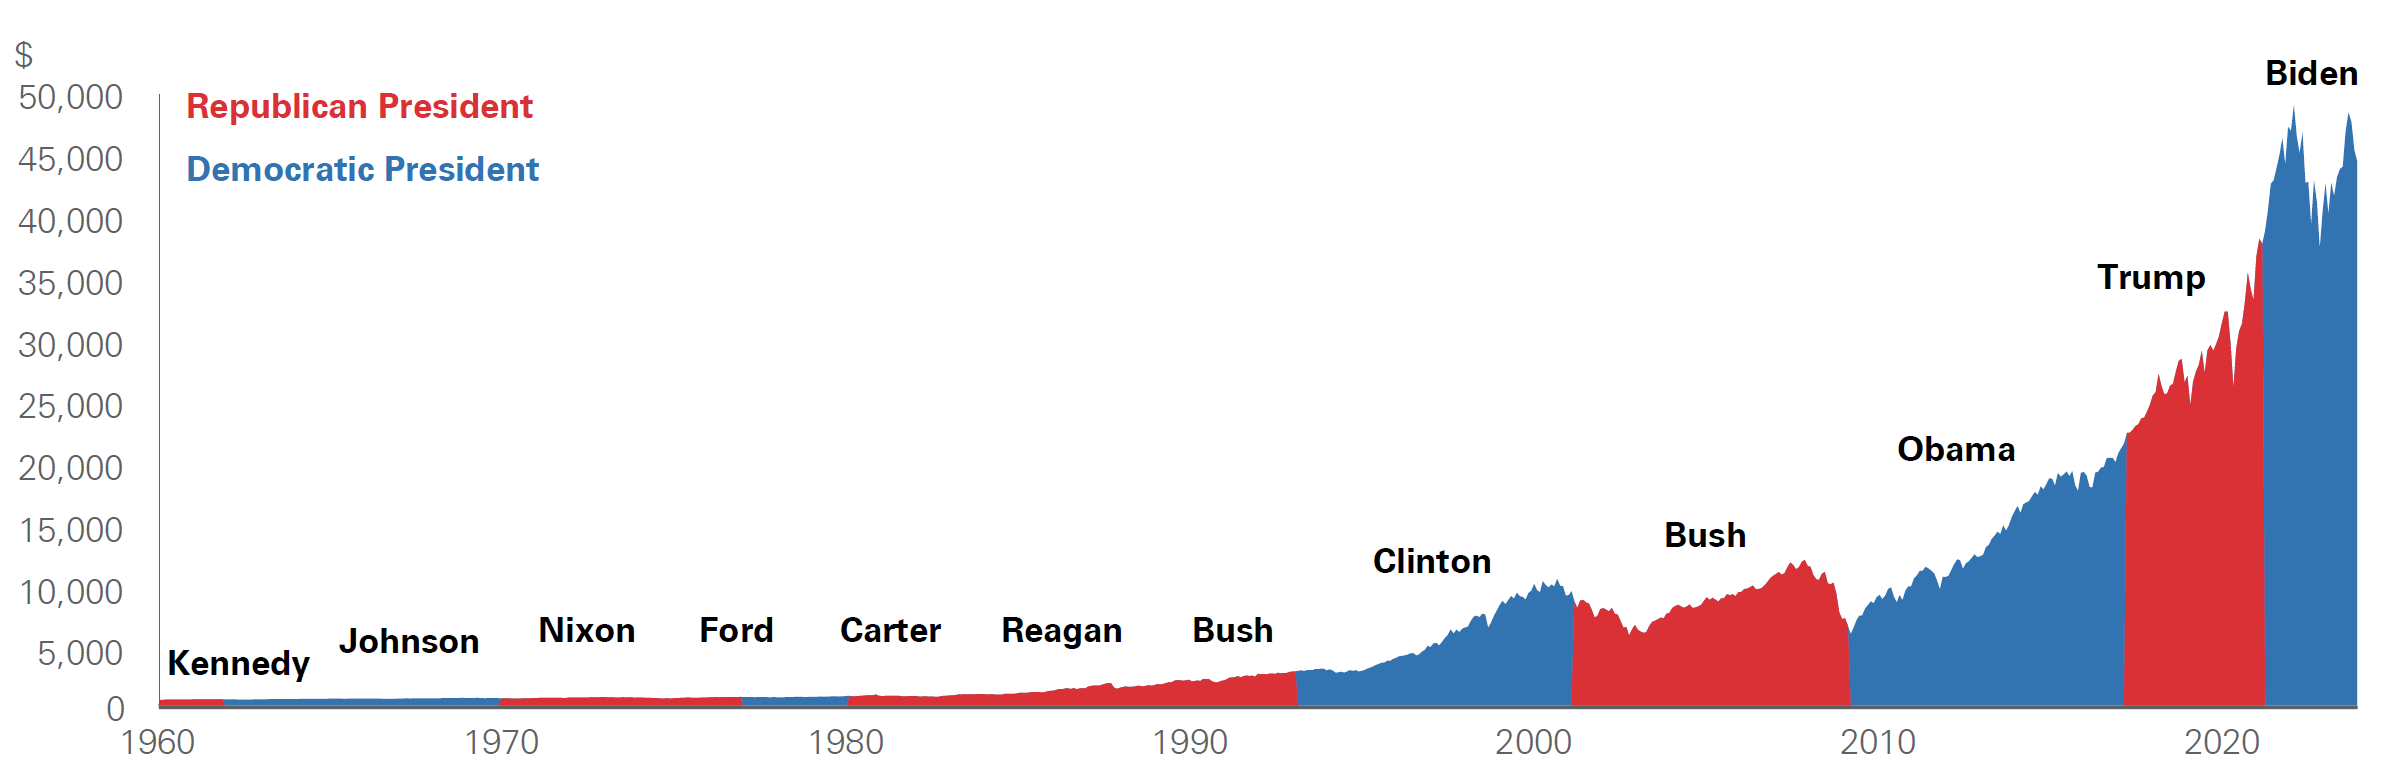
A long-term performance chart showing how a hypothetical $100 invested in the S&P 500 at the start of 1960 would grow through 2023, illustrating that equity markets have tended to appreciate over the long term regardless of shifting political leadership. This reinforces the article’s point on markets being driven more by fundamentals than by short-term political noise.
Source: Bloomberg
Base case: divided Congress
While the outcome of the presidential election remains uncertain at this point, congressional dynamics appear to set the stage for a split Congress as both chambers could flip in 2024. Republicans only need to win back one or two Senate seats, and Democrats need to net five additions in the House to take control of the respective chambers. The Senate map is tilted heavily in favor of the Republicans with Democrats defending far more competitive states.
For example, Republicans are defending only 11 seats compared to the Democrats’ 23 seats, of which eight are considered highly competitive. A difficult setup for Republicans in the House creates a favorable setup to flip the chamber to Democratic control. Nearly four times as many Republicans are defending swing districts that have been won by the presidential candidate of the opposing party. Thus, while numerous outcomes remain possible, our base case for the 2024 election is a divided government regardless of the presidential outcome. Even in the event of a red or blue wave, we view the likelihood of either party gaining more than 60 Senate seats as extremely low, thus limiting the potential for sweeping policy changes that aren’t primarily budgetary in nature.
Election outcomes and portfolio positioning
As has been proven time and time again, election outcomes are impossible to predict. Still, gauging the probabilities of different outcomes and examining potential scenarios can be a productive exercise. While our base case for the 2024 election is a divided Congress, whether the presidency is won by Republicans or Democrats, we have also evaluated the potential impact of a blue or red wave, which could significantly shift policy outcomes (see Exhibit 8).
Exhibit 8: Blue Wave or Red Wave
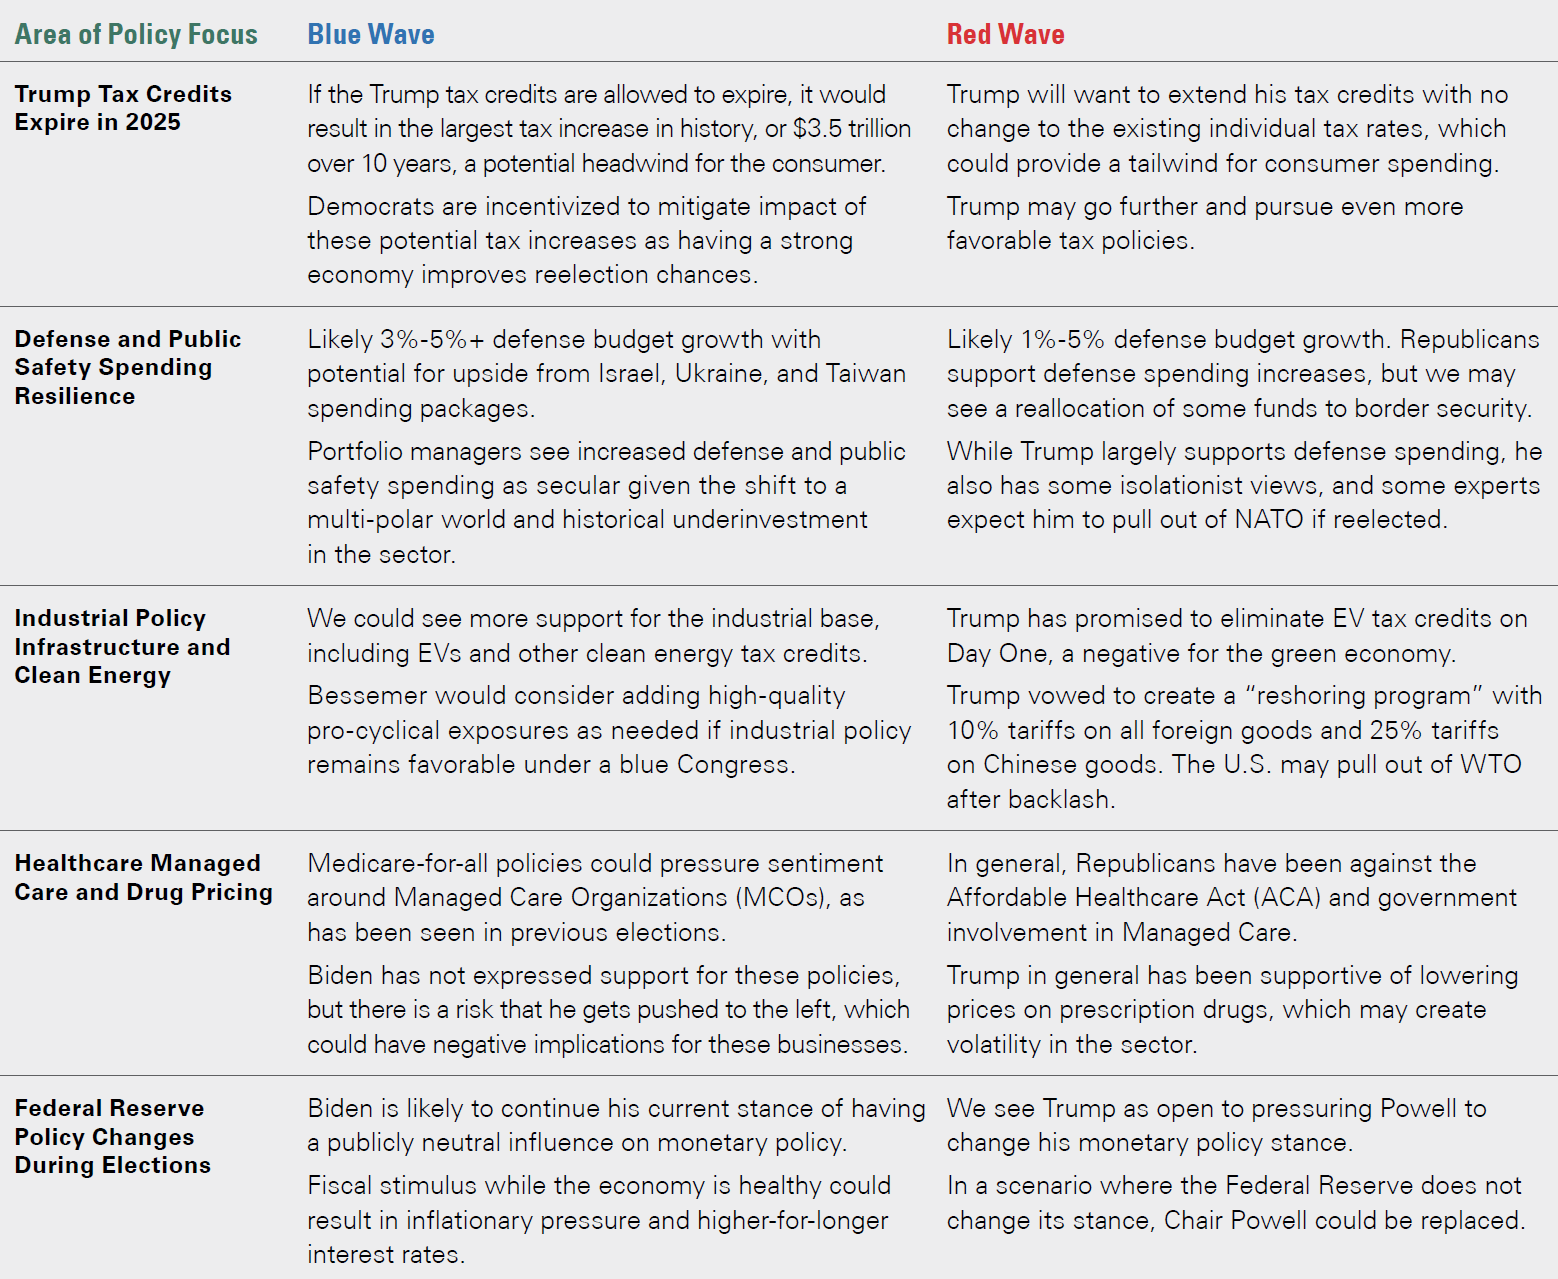
| Area of Policy Focus | Blue Wave | Red Wave |
| Trump Tax Credits Expire in 2025 | If the Trump tax credits are allowed to expire, it would result in the largest tax increase in history, or $3.5 trillion over 10 years, a potential headwind for the consumer. Democrats are incentivized to mitigate impact of these potential tax increases as having a strong economy improves reelection chances. | Trump will want to extend his tax credits with no change to the existing individual tax rates, which could provide a tailwind for consumer spending. |
| Defense and Public Safety Spending Resilience | Likely 3%-5%+ defense budget growth with potential for upside from Israel, Ukraine, and Taiwan spending packages. Portfolio managers see increased defense and public safety spending as secular given the shift to a multi-polar world and historical underinvestment in the sector. | Likely 1%-5% defense budget growth. Republicans support defense spending increases, but we may see a reallocation of some funds to border security. While Trump largely supports defense spending, he also has some isolationist views, and some experts expect him to pull out of NATO if reelected. |
| Industrial Policy Infrastructure and Clean Energy | We could see more support for the industrial base, including EVs and other clean energy tax credits. Bessemer would consider adding high-quality pro-cyclical exposures as needed if industrial policy remains favorable under a blue Congress. | Trump has promised to eliminate EV tax credits on Day One, a negative for the green economy. Trump vowed to create a “reshoring program” with 10% tariffs on all foreign goods and 25% tariffs on Chinese goods. The U.S. may pull out of WTO after backlash. |
| Healthcare Managed Care and Drug Pricing | Medicare-for-all policies could pressure sentiment around Managed Care Organizations (MCOs), as has been seen in previous elections. Biden has not expressed support for these policies, but there is a risk that he gets pushed to the left, which could have negative implications for these businesses. | In general, Republicans have been against the Affordable Healthcare Act (ACA) and government involvement in Managed Care. Trump in general has been supportive of lowering prices on prescription drugs, which may create volatility in the sector. |
| Federal Reserve Policy Changes During Elections | Biden is likely to continue his current stance of having a publicly neutral influence on monetary policy. Fiscal stimulus while the economy is healthy could result in inflationary pressure and higher-for-longer interest rates. | We see Trump as open to pressuring Powell to change his monetary policy stance. In a scenario where the Federal Reserve does not change its stance, Chair Powell could be replaced. |
Bottom-up fundamental research on companies paired with top-down macroeconomic views drives Bessemer’s portfolio construction. Politics is certainly a factor, but usually not the dominant one. That said, we contemplate portfolio positioning entering election season as well as potential future adjustments to our sector and company allocations in evaluating a range of potential political outcomes.
- Defense and public safety: In the last 50 years, defense companies have outperformed the equity market in election years approximately 80% of the time. Heightened geopolitical conflicts and wars can be tailwinds to their businesses, while constrained government spending is a potential headwind. At this point, both political parties seem to support robust defense spending, even as overall government spending levels are in the crosshairs. We have exposure to the defense industry currently — Bessemer equity portfolios maintain overweight positions in Northrop Grumman and Lockheed Martin, defense companies that are likely to be beneficiaries of heightened defense spending. We also maintain positions in public safety technology companies like Motorola Solutions and Axon Enterprise, which are exposed to highly durable, less politically sensitive growth in state and local spending.
- Healthcare: Interestingly, negative healthcare insurance rhetoric has been a consistent theme during election primaries, and often stocks in this sector underperform before elections as a result. Historically, these periods of weakness have created opportunities to increase exposure to high-quality companies in this area as actual policy changes usually fall short of what the escalated rhetoric and stock price volatility imply. Bessemer equity portfolios maintain positions in several high-quality healthcare companies that portfolio managers believe are well positioned to benefit from attractive demographic trends given an aging population. For example, vertically integrated health insurance company UnitedHealthcare has a leading position in the shift of government-sponsored healthcare to managed care, with significant penetration available amid further industry consolidation. Meanwhile, Thermo Fisher and Danaher are high-quality companies in the life science instruments market that are well positioned to compound earnings over time.
- Consumer discretionary: Absent a Republican sweep, current income tax rates are expected to move significantly higher in 2026, potentially amounting to the largest tax increase in history: $3.5 trillion over 10 years. A divided government could produce fiscal tightening as some tax cuts would expire without additional spending. This scenario could create a headwind for consumer spending, which has been resilient despite inflationary pressures. Many consumer stocks are priced in a way that suggests investors may underappreciate potential tax changes. However, we do see potential for a Democratic or Republican administration to compromise to mitigate this headwind, as all are incentivized to have a strong economy to boost their reelection chances. Even if any consumer weakness occurs, it should disproportionately impact cyclically oriented consumer companies, where Bessemer doesn’t have significant exposure. With any potential tax headwinds, we may adjust portfolios, but our broad approach to this sector is to invest in companies well diversified across geographies and exposed to secular themes, such that we are less affected by any broader slowdown in one country. For example, some of our more notable consumer holdings include LVMH, which is exposed to luxury spending growth globally, and O’ Reilly Automotive, which sells primarily non-discretionary auto parts. Both companies, as well as many of our other consumer holdings, have exhibited steady above-market earnings growth through various economic cycles.
Concluding Thoughts
In times of confrontational political rhetoric and rising geopolitical concerns, it is helpful to step back and broaden the view. Over time, the key drivers of returns in the financial markets have been corporate earnings, interest rates, inflation, valuations, and the health of the global economy. Politics can loom large in the short run, and while those risks seem elevated today, we believe other factors play a more decisive long-term role.
Although many economists have been forecasting a recession since early 2022, it hasn’t happened yet. It could still happen, as the economy continues to digest the impact of significantly higher interest rates, which takes time, but even if a recession occurs, we believe it is likely to be mild. The corporate sector has had nearly two years to prepare for the recession that hasn’t yet hit, and CEOs and CFOs are ready. Corporations are nimble, shifting resources and priorities to react to changing conditions. Corporate and household balance sheets look resilient. Although real GDP has been 2.9% higher in the first three quarters of the year, earnings have already suffered, with aggregate S&P 500 last-12-month earnings down 2% year-to date through October. Although we do expect the economy to slow over the next few quarters, a resumption of earnings growth is likely in the coming year.
Consumers have been resilient thus far, with real consumption up 2.4% over the last 12 months, and the Fed appears to be done with its hiking cycle. While the Fed may not cut interest rates right away, there is ample room to do so if the economy weakens precipitously with short-term rates in the 5.0%–5.5% range.
Asset Allocation
In working with individual families and clients, one of our goals is to develop the most appropriate strategic, or long-term, asset allocation. A client’s portfolio should hold enough higher-return, higher-risk assets, such as stocks and private assets, to meet a family’s long-term return goals. But it should also have enough in lower-risk assets — whether cash, bonds, or alternatives, such as lower-volatility hedge funds. Ideally, an investor’s long-term asset allocation balances return and risk well enough that investors don’t need to make big changes to their allocation unless something significant changes in their lives. Markets are very difficult to time, and often big shifts in asset allocation end up costing investors. This is because markets are forward-looking, and usually when the news appears bleak, much of the downside has already been priced into the markets.
Portfolios today are positioned close to their strategic asset allocations (Exhibit 9) with a slight overweight to equities and underweight to fixed income. We also recommend continued exposure to a range of alternative assets. In equity portfolios, we own companies that we believe can grow their earnings in a challenging economic environment. Many are selected for their pristine balance sheets, management discipline, and ability to generate cash flow and produce high returns on equity for their investors. We continue to overweight the U.S. market, which we expect to have fewer headwinds compared to the rest of the world. In bond portfolios, we have slightly longer maturities than our benchmarks, as we expect growth to slow and longer-term interest rates to fall from current levels.
Exhibit 9: Balanced Growth 70/30 Asset Allocation with Alternatives
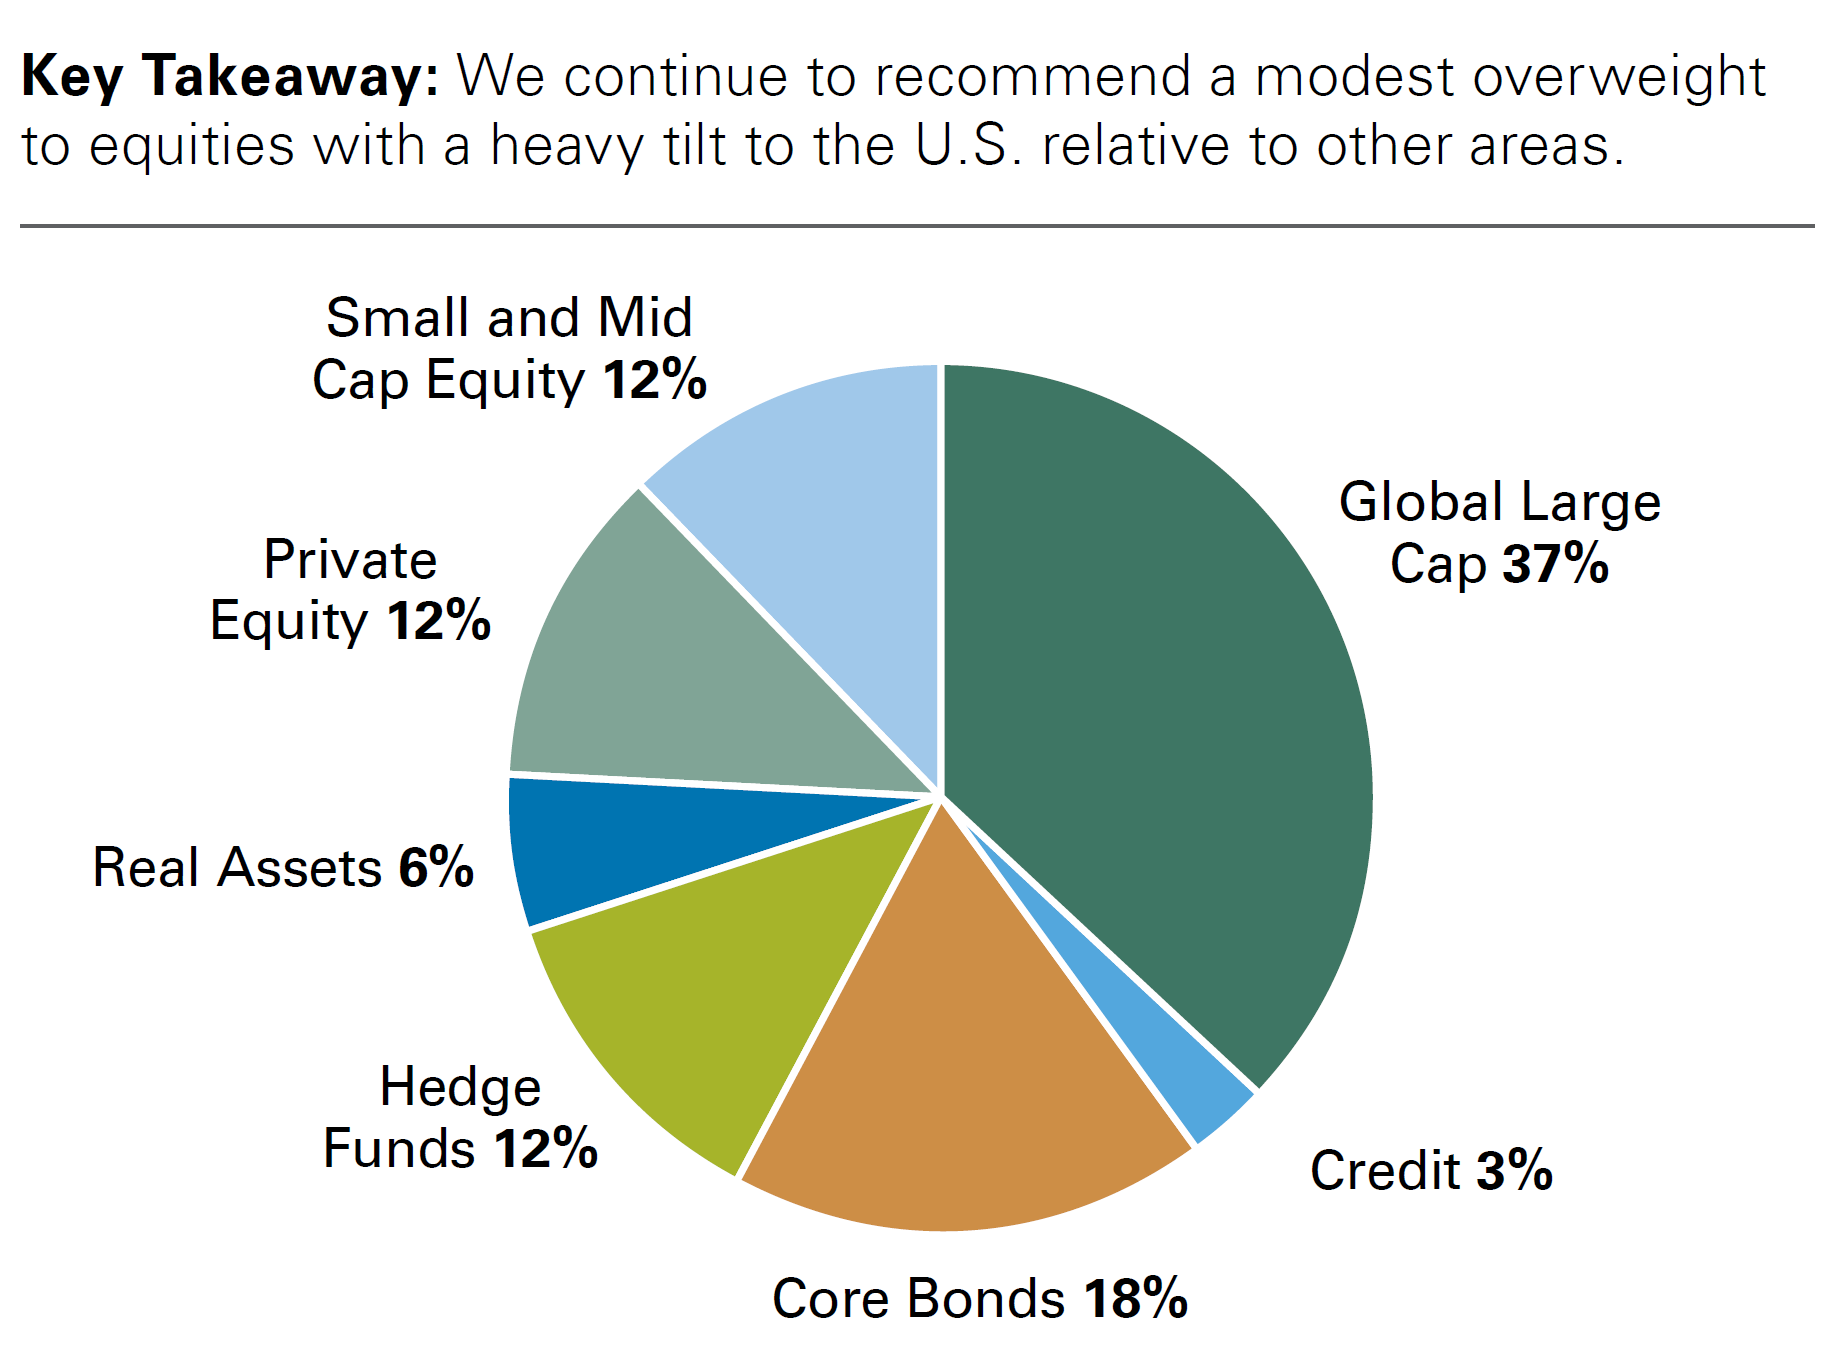
A diversified asset allocation pie chart illustrating a 70/30 portfolio (70% equities and 30% non-equities) expanded with alternative investments. It shows allocations by major asset category, such as global large-cap equities, core bonds, small- and mid-cap equities, private equity, hedge funds, real assets, and credit, reflecting how portfolios are positioned amid political and economic uncertainty.
Source: Bessemer Trust
Past performance is no guarantee of future results. This material is provided for your general information. It does not take into account the particular investment objectives, financial situations, or needs of individual clients. This material has been prepared based on information that Bessemer Trust believes to be reliable, but Bessemer makes no representation or warranty with respect to the accuracy or completeness of such information. This presentation does not include a complete description of any portfolio mentioned herein and is not an offer to sell any securities. Investors should carefully consider the investment objectives, risks, charges, and expenses of each fund or portfolio before investing. Views expressed herein are current only as of the date indicated, and are subject to change without notice. Forecasts may not be realized due to a variety of factors, including changes in economic growth, corporate profitability, geopolitical conditions, and inflation. The mention of a particular security is not intended to represent a stock-specific or other investment recommendation, and our view of these holdings may change at any time based on stock price movements, new research conclusions, or changes in risk preference. Index information is included herein to show the general trend in the securities markets during the periods indicated and is not intended to imply that any referenced portfolio is similar to the indexes in either composition or volatility. Index returns are not an exact representation of any particular investment, as you cannot invest directly in an index. Alternative investments, including private equity, real assets and hedge funds of funds, are not suitable for all clients and are available only to qualified investors.