
Active and Passive Management: Aligning Approach and Objectives

- Active and passive strategies reflect different assumptions about how markets function and where investment judgment can add value.
- Market dynamics are evolving alongside investor composition, as an increasing share of trading is being driven by market participants whose objectives differ from those of long-term, fundamentally focused investors.
- We explore the forces shaping this environment and offer practical considerations to help investors determine the approach that aligns with their investment goals and time horizon.
For investors considering active and passive approaches, the decision involves more than relative performance and fees. Each approach reflects a different set of assumptions and beliefs about how markets function and where investment judgment can add value. Understanding those assumptions and beliefs can help investors determine their preferred way to navigate markets to meet their goals.
Investing in active strategies means choosing the judgment of professional analysts and portfolio managers to make security selection, portfolio construction, and risk management decisions. Meanwhile, investing in passive strategies means choosing the collective views and decisions of all market participants, often described as “the wisdom of the crowds.”
In evaluating active judgment relative to a passive approach over a particular time horizon, it is important to understand the composition of these crowds. They comprise a wide variety of investors, with different objectives and time frames. Collectively, these objectives and time frames may or may not align with those of a particular individual.
Furthermore, the composition of this collective has been evolving, influencing market dynamics. A meaningful share of trading is conducted by market participants whose objectives and time horizons may differ from those of long-term, fundamentally focused investors.
What Influences Market Prices
Simply holding a stock does not impact its price. A stock‘s price changes when it is traded; therefore, stock prices are influenced more by the decisions of market participants who trade more frequently than by those who buy and hold for the long term. Trading decisions can be made for a variety of reasons, including fundamental, technical, speculative, liquidity, and hedging. Short-term trading is more likely to be influenced by factors other than long-term fundamentals.
Hedge funds, which make up between 10% and 25% of trading volumes, employ a diverse set of strategies. Many of them seek to capitalize on short-term mispricings, which may be driven by technical rather than fundamental factors. For such strategies, holding periods can be measured in hours, days, or weeks.
Retail investors now account for 20% to 30% or more of overall trading volume, compared with less than 10% over the last decade. Their market participation began accelerating in 2018, as technology facilitated easier and cheaper access.
An increasing share of trading occurs through leveraged instruments commonly used for short-term positioning rather than for long-term fundamental investing (as seen in Exhibit 1).
Exhibit 1: Options Contract Volume Over Time
Key takeaway: Options contract volumes have surged since 2020.
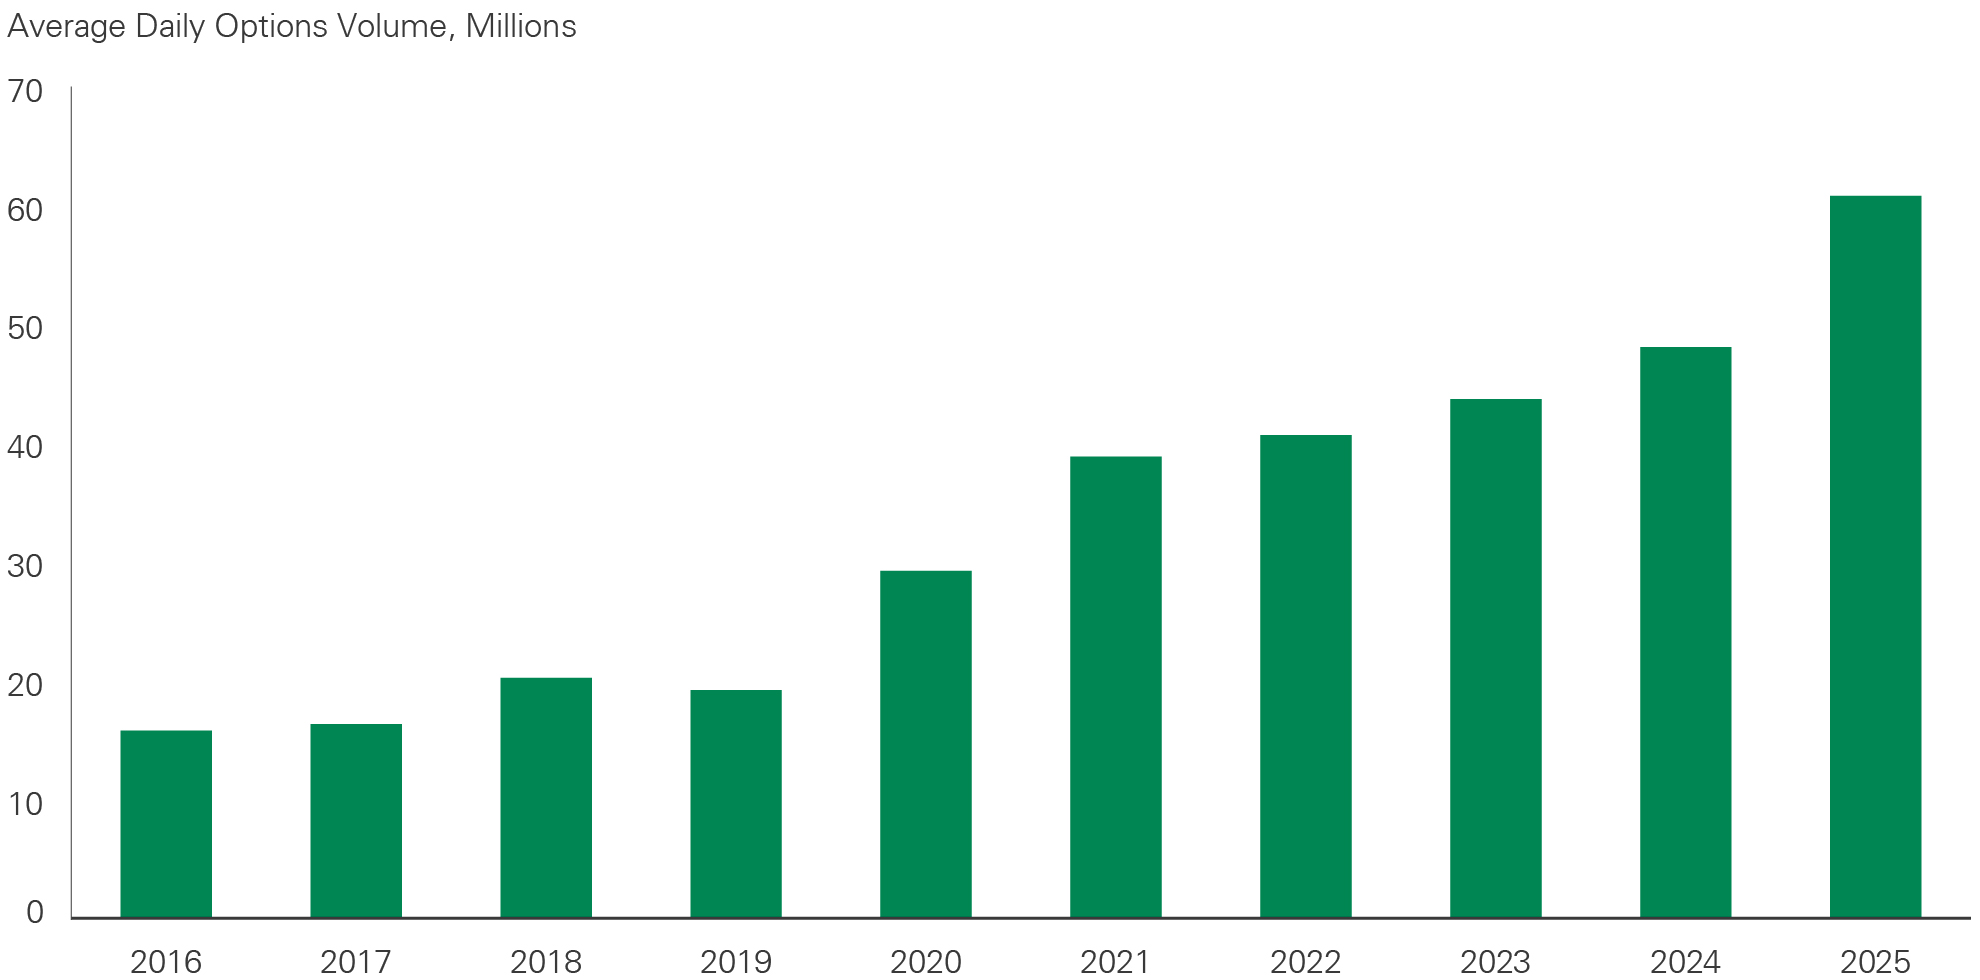
Bar chart titled “Average Daily Options Volume, Millions.” The horizontal axis covers 2016 through 2025, and the vertical axis ranges from 0 to 70 million. Approximate annual volumes are 16 million in 2016, 17 million in 2017, 21 million in 2018, 20 million in 2019, 30 million in 2020, 39 million in 2021, 41 million in 2022, 44 million in 2023, 48 million in 2024, and 61 million in 2025. Volume increases substantially over the period, with a slight decline in 2019 and the strongest growth occurring after 2020.
Options trading volumes have almost quadrupled over the past decade. Their nature has also been evolving. Volumes for single-day S&P 500 options accounted for 59% of total S&P 500 options volume in 2025.1 These contracts are used to express or hedge short-term, often technical or speculative, views or strategies, rather than long-term fundamental views associated with traditional active equity ownership.
Leveraged ETF assets have also grown quickly, with new product launches having accelerated over the past three years and more than 400 introduced between 2025 and 2026. Today, assets total approximately $200 billion, accounting for as much as 20% of daily trading volume, according to industry estimates.2 Leveraged ETFs are short-term instruments, structured to maintain their price relationship to the underlying asset over the course of a single trading day.
Leverage amplifies returns both on the upside and the downside, and it magnifies volatility and momentum. Options trading can also become a technical driver of stock prices. Market makers who write call options typically purchase the underlying stock to hedge their positions. High volumes of option writing can drive up the price of the underlying stock, necessitating further purchases to maintain the hedge. Higher prices may in turn result in additional buying activity. This can reinforce a positive sentiment loop, amplifying price momentum for the underlying asset. However, speculative positioning is subject to sharp reversals, and these dynamics can amplify price reversals if sentiment turns.
Impact on Market Dynamics
Market returns can be decomposed into changes in fundamentals (reflected in earnings) and in sentiment (implied in the price investors assign to earnings over time). The volatility of valuations (e.g., of price-to-earnings ratios) can therefore serve as a proxy for the volatility of investor sentiment. It is also one component of overall market volatility.
The data, as seen in Exhibit 2, indicate a regime change beginning in 2018, with baseline levels of sentiment volatility resetting to a higher level outside periods of market stress. This shift coincided with the acceleration of retail trading.
Exhibit 2: Volatility of S&P 500 Valuations
Key takeaway: Market data suggest investor sentiment has become more volatile.
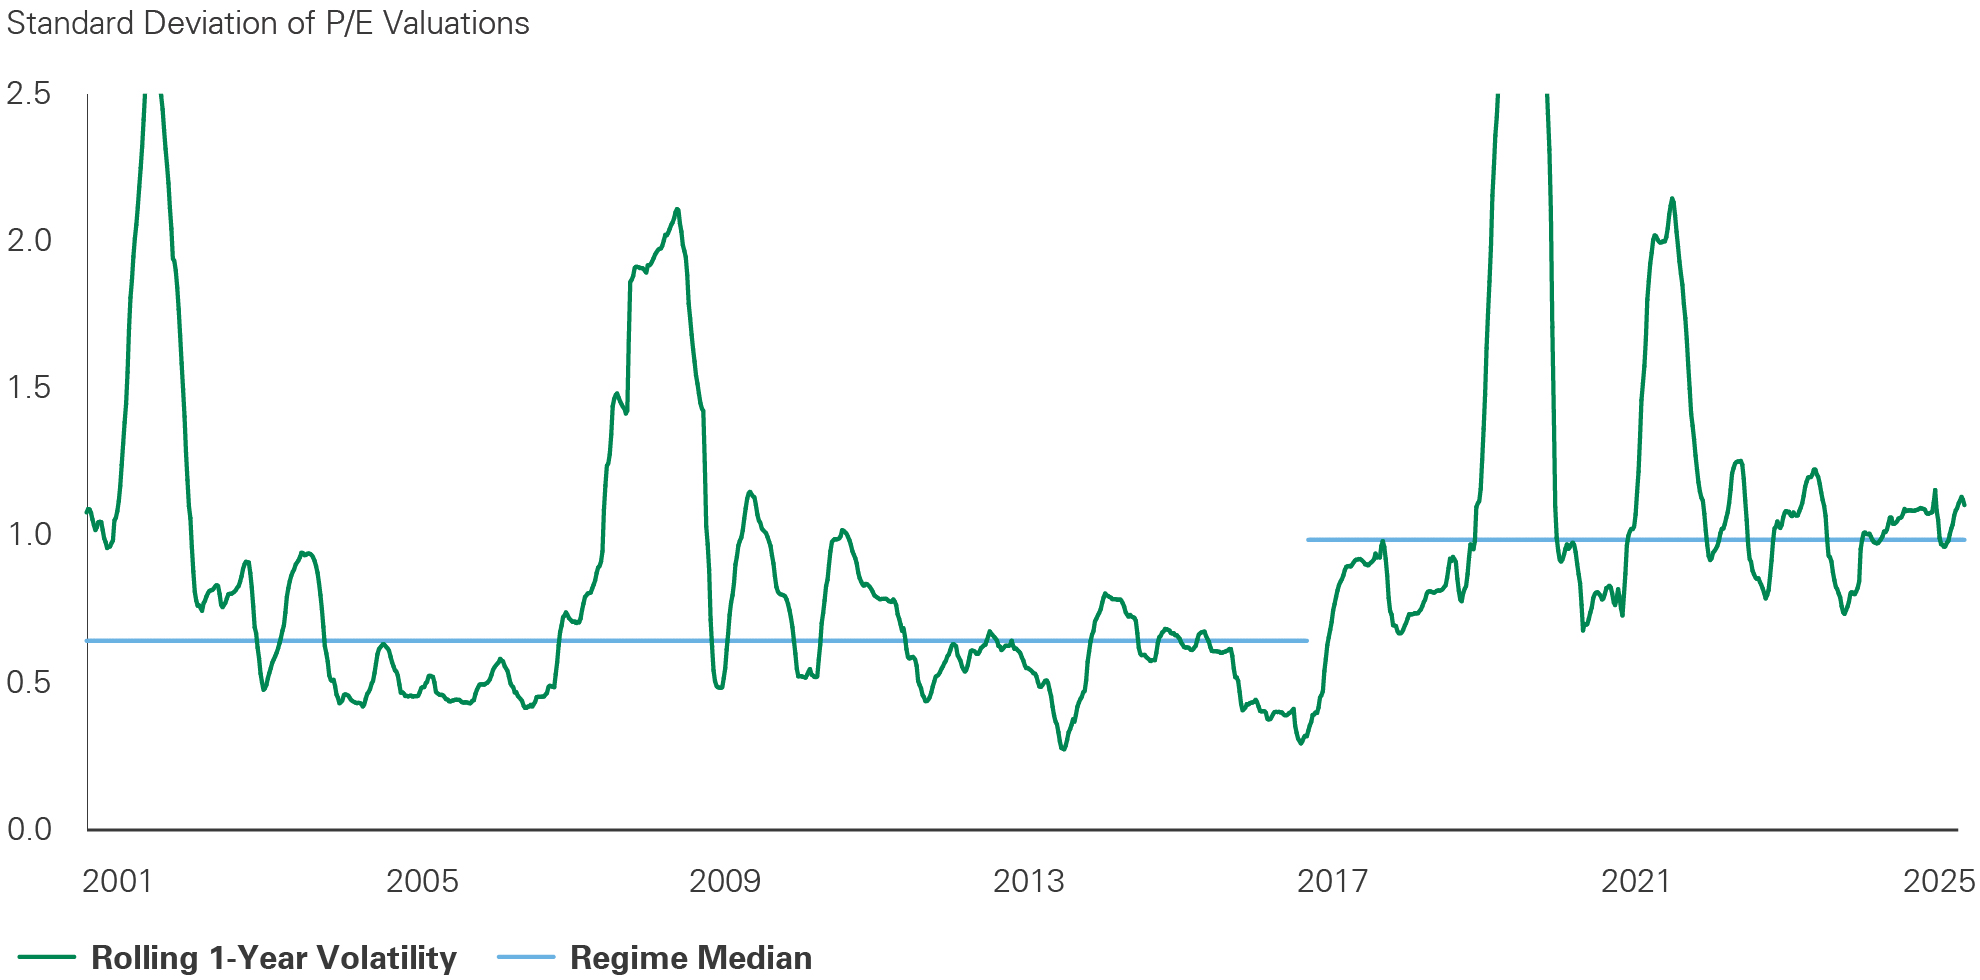
Line chart titled “Standard Deviation of P/E Valuations.” The green line represents rolling one-year volatility from approximately 2000 through 2025, while blue horizontal lines represent the median for two market regimes. Volatility generally ranges from about 0.3 to above 2.5. Major peaks occur around 2001, 2008, 2019–2020, and 2021. The regime median is approximately 0.64 through 2016 and rises to approximately 0.98 beginning in 2017. After the sharp 2021 spike, volatility fluctuates mostly between 0.7 and 1.2 and ends near 1.1 in 2025.
How Passive Investing Can Influence the Market
Passive investing has now surpassed active management in popularity, representing more than 50% of industry assets, as seen in Exhibit 3.
Exhibit 3: Passive Investing Share of AUM
Key takeaway: Passive investing has grown to represent more than 50% of industry assets.
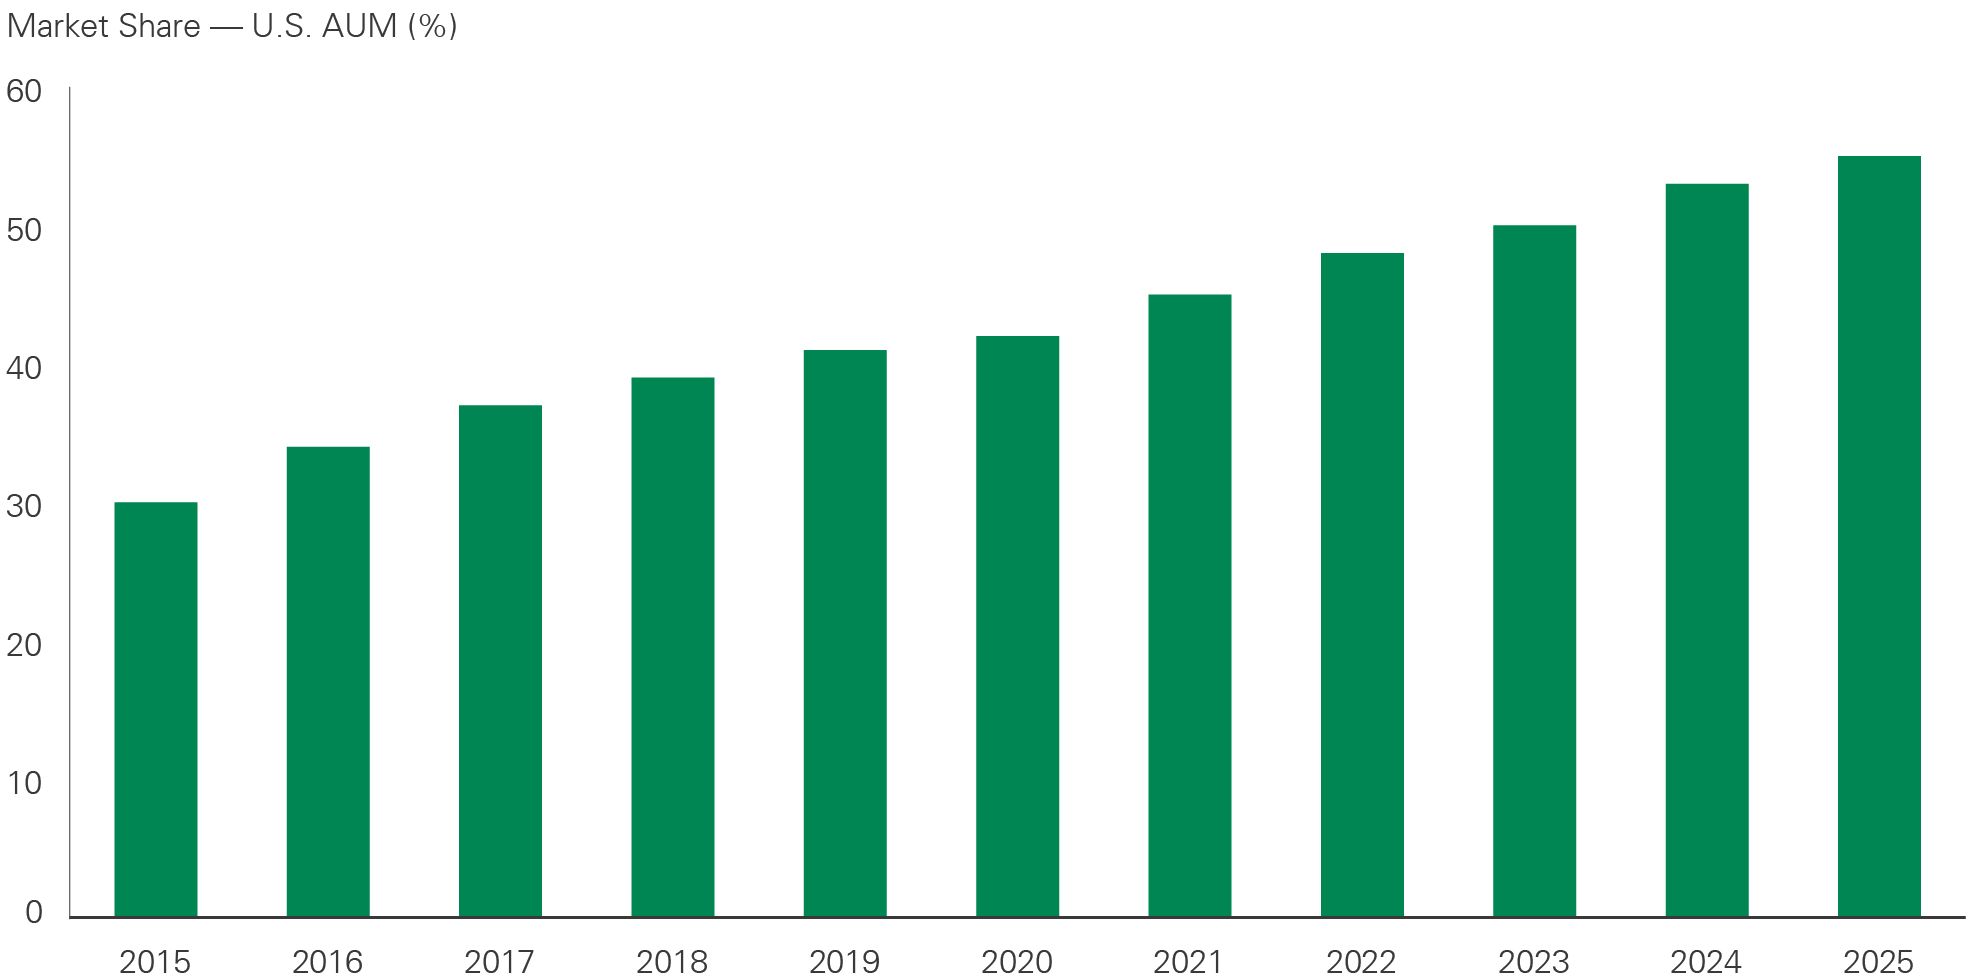
Bar chart titled “Market Share — U.S. AUM (%).” The horizontal axis covers 2015 through 2025, and the vertical axis ranges from 0% to 60%. Approximate market shares are 30% in 2015, 34% in 2016, 37% in 2017, 39% in 2018, 41% in 2019, 42% in 2020, 45% in 2021, 48% in 2022, 50% in 2023, 53% in 2024, and 55% in 2025. Market share rises consistently throughout the period, with no annual declines.
As passive investing grows in prominence, its influence on market dynamics is increasing.
A recent academic study found that higher passive stock ownership was associated with reduced importance of fundamentals in setting market prices, greater impact from transitory noise, elevated stock volatility and risk of extreme price moves, and, on average, greater mispricing. These effects persisted over periods ranging from several trading days to more than a year.3
To understand how passive investing influences the market, it is helpful to understand decisions made in the process. Benchmark providers make decisions during index reconstitution. Reconstitutions of capitalization-weighted benchmarks, which most passive funds track, are based on market value changes since the prior reconstitution.
Some indices have specific security inclusion criteria beyond company size, which may drive different outcomes. For instance, while both the S&P 600 and the Russell 2000 are capitalization-weighted indices tracking small-cap U.S. stocks, the former screens for positive earnings over the prior four quarters, while the latter does not.
At the same time, inclusion criteria are still applied to past performance. Whether or not fundamentals are considered, the process is designed to reflect the past and forgo judgment about the future.
Passive implementation also involves making investment decisions. Managers make implementation decisions when investing new flows and reflecting index reconstitutions in their portfolios. Their objective is to track the benchmark efficiently while managing transaction costs. As a result, these managers may not trade every security in an index, instead focusing on larger, more liquid constituents and not always trading the smallest, least liquid ones.
For capitalization-weighted strategies, this process results in flows that further increase portfolio weights for companies with greater market values, including those that have appreciated relative to other index constituents, regardless of whether that appreciation reflects earnings growth or multiple expansion. It is also agnostic as to whether past winners are also best positioned for the future.
The distinction matters, however. History demonstrates the difficulty of sustaining high growth rates over long periods, whether due to natural limits to growth, disruption from new entrants, or regulatory reasons (e.g., antitrust). A recent study found that while 72% of S&P 500 companies have been able to generate revenue growth of more than 20% at some point over the past 40 years, less than 10% of them still generated growth above that threshold five years later.4
The same study found that periods with the highest degree of market concentration (such as today’s) had 30% to 50% more volatile returns over the subsequent year than periods of average or below-average market concentration.
Passive strategies, by design, remain invested according to the methodology of their benchmark indexes and therefore reflect these market dynamics. Active managers, by contrast, have discretion to adjust portfolio weights based on forward-looking views, valuation assessments, and risk-management frameworks.
Whether the investor would find that discretion additive depends on their objectives and beliefs about market structures. The following questions may help frame that evaluation.
Key Questions to Help Guide Your Approach
How do you define “investing success”?
While this depends on the individual investor, many individuals view their investment portfolio as a means of meeting their lifestyle and legacy goals. To the extent that an investor defines success in terms of the portfolio’s ability to do so, performance may be better evaluated relative to the returns needed to achieve those goals, rather than relative to a market index that reflects the views of a wide range of market participants solving for a wide range of goals.
Other individuals may seek to obtain market-level returns as their primary objective. Passive investing is an efficient way to achieve that goal. In selecting a specific passive fund, the inclusion criteria of the index it tracks is a de facto way for the investor to express a view; fund selection is itself an active choice.
Other investors may define success as a mix of both, with their primary objective centered on achieving long-term lifestyle and legacy goals, while market returns provide a valuable reference point.
Do you believe that history is a guide for the future?
Today, a greater share of market activity is being driven by shorter-term, in some cases speculative, rationales than was the case in the past. As such, near-term performance can be heavily influenced by sentiment. Sentiment-driven performance is generally less predictable.
However, there is compelling evidence that long-term returns have historically been driven by fundamentals, and that quality has outperformed through a full market cycle. Approximately 68% of the S&P 500’s return over the past 30 years is attributed to earnings growth, with an additional 19% from dividend yield, as seen in Exhibit 4. Active managers seek to capitalize on this dynamic by identifying companies they believe have superior fundamentals and the potential to compound value over time. Passive strategies, by design, do not select securities based on forward-looking fundamental assessments.
Therefore, an investor’s preferred balance between active and passive strategies may depend on the extent to which they believe that fundamentals will continue to drive returns over longer horizons and that experienced judgment can improve outcomes over their investment horizon.
Exhibit 4: S&P 500 Total Returns: 30-Year Lookback
Key takeaway: Long-term returns have historically been driven by fundamentals.
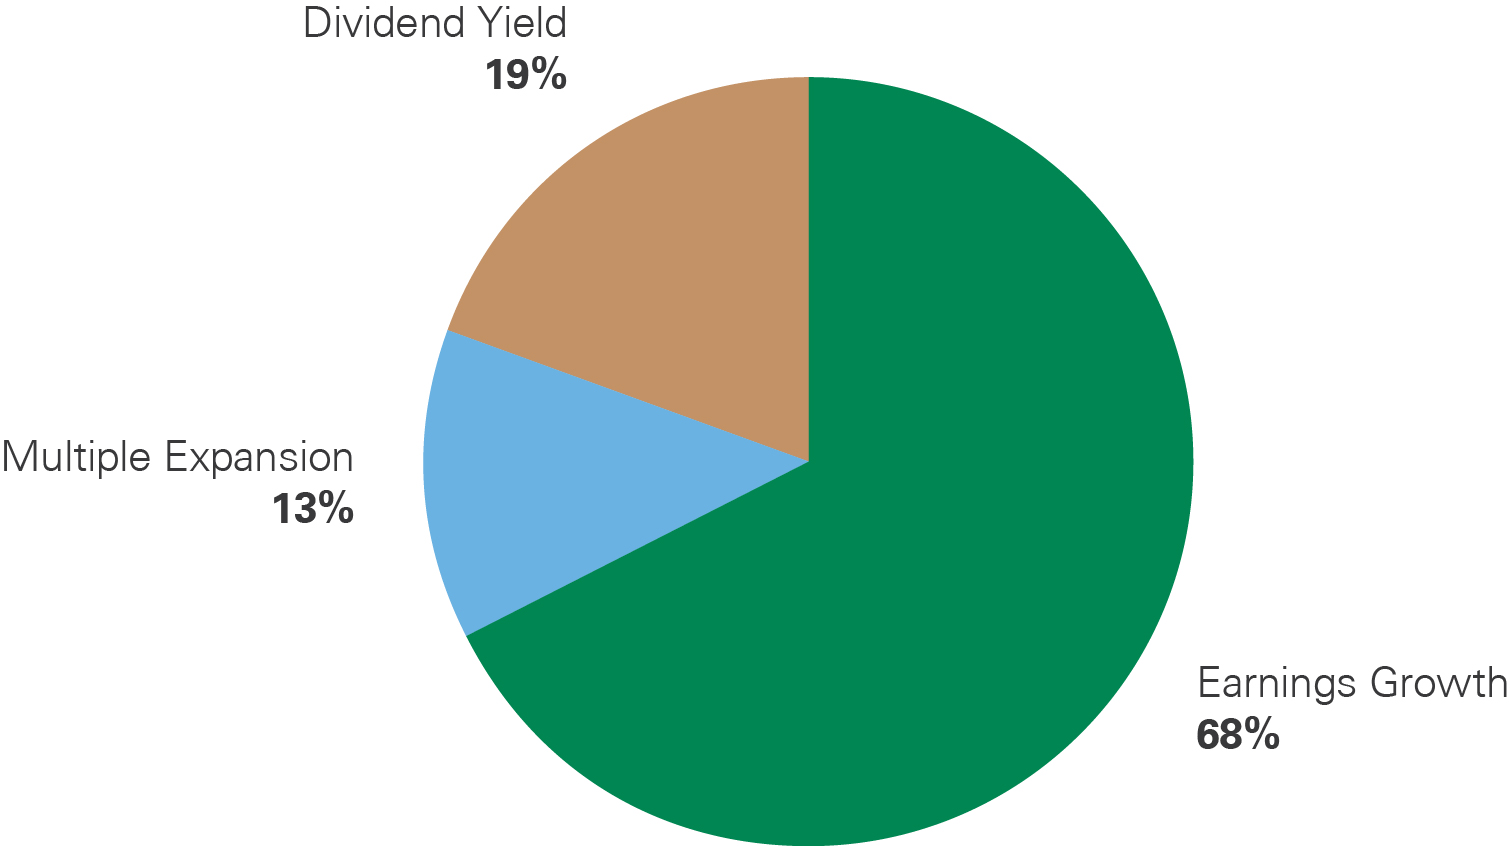
Pie chart divided into three components. Earnings growth is the largest component at 68%, accounting for more than two-thirds of the total. Dividend yield represents 19%, and multiple expansion represents the remaining 13%. The three components total 100%.
What is your investment time frame, and how does it compare to the time horizon you are using to evaluate your manager?
A market with a growing share of sentiment-driven, less predictable activity can make it more difficult for active managers to outperform passive market-tracking strategies over shorter time frames. For investors with multi-year horizons who believe that fundamentals will continue to matter over market cycles, and who therefore place value on fundamental security selection, evaluating active managers over an appropriate market cycle may provide a more meaningful assessment of the value the managers' judgment delivers.
The appropriate approach depends on each investor’s individual goals, preferences, and time horizon. At Bessemer Trust, we work closely with our clients to understand their unique situations. We consider return objectives, tolerance for risk and volatility, the desired balance between wealth preservation and growth potential, tax considerations, estate planning needs, time horizons, and other factors to create fully customized investment programs to meet each client’s unique needs.
For guidance on the strategies that best align with your objectives, please contact your Bessemer advisor.
- CBOE, as of January 2026.
- Strategas, as of July 2026.
- Philipp Hofler, Christian Schlag, and Maik Schmeling, Passive Investing and Market Quality, Aug. 22, 2025.
- Goldman Sachs Asset Management, as of October 2024.
Past performance is no guarantee of future results. This material is provided for your general information. It does not take into account the particular investment objectives, financial situations, or needs of individual clients. This material has been prepared based on information that Bessemer Trust believes to be reliable, but Bessemer makes no representation or warranty with respect to the accuracy or completeness of such information. This presentation does not include a complete description of any portfolio mentioned herein and is not an offer to sell any securities. Views expressed herein are current only as of the date indicated and are subject to change without notice. Forecasts may not be realized due to a variety of factors, including changes in economic growth, corporate profitability, geopolitical conditions, and inflation. The mention of a particular security is not intended to represent a stock-specific or other investment recommendation, and our view of these holdings may change at any time based on stock price movements, new research conclusions, or changes in risk preference.