Oil Shock in Five Pictures: How Resilient Is the U.S. Economy?

The war in the Middle East that began on February 28 has precipitated the largest oil supply disruption in history. The closure of the Strait of Hormuz has impacted approximately 20 million barrels per day of crude oil and petroleum product supply, or 20% of global supply, as well as a similar share of global liquified natural gas (LNG) flows. Efforts to mitigate the disruption are underway. An estimated 4 to 6 million barrels per day of oil supply can be rerouted from the Strait, while output has increased among non-OPEC producers. In addition, the International Energy Agency (IEA) has coordinated a release of 400 million barrels from emergency oil reserves. Even so, a meaningful portion of supply remains constrained, compounded by damage to energy infrastructure resulting from the war.
In the face of uncertainty, it is worth remembering that businesses and consumers tend to adjust better than expected, as seen recently following the Liberation Day tariffs. The current conflict represents another relative price shock that will prompt behavioral adjustments for consumers and businesses. Increases in U.S. oil and gasoline prices to date remain manageable and below prior shock levels. While oil shocks have preceded recessions in the past, the structure of the U.S. economy has evolved meaningfully over the past two decades. Although higher energy prices present a headwind, the knock-on effects to growth, inflation, and financial conditions are more muted than in prior cycles. The resulting upward pressure on core inflation is likely to be limited, and we continue to expect the Federal Reserve (Fed) to proceed with its rate-cutting cycle as long as inflation expectations remain anchored. Finally, while the scale of the current supply disruption leaves regions heavily reliant on Gulf energy imports particularly exposed to oil shortages, the U.S., as one of the world’s largest oil and natural gas producers, remains relatively insulated from both price and availability shocks should the Strait remain closed.
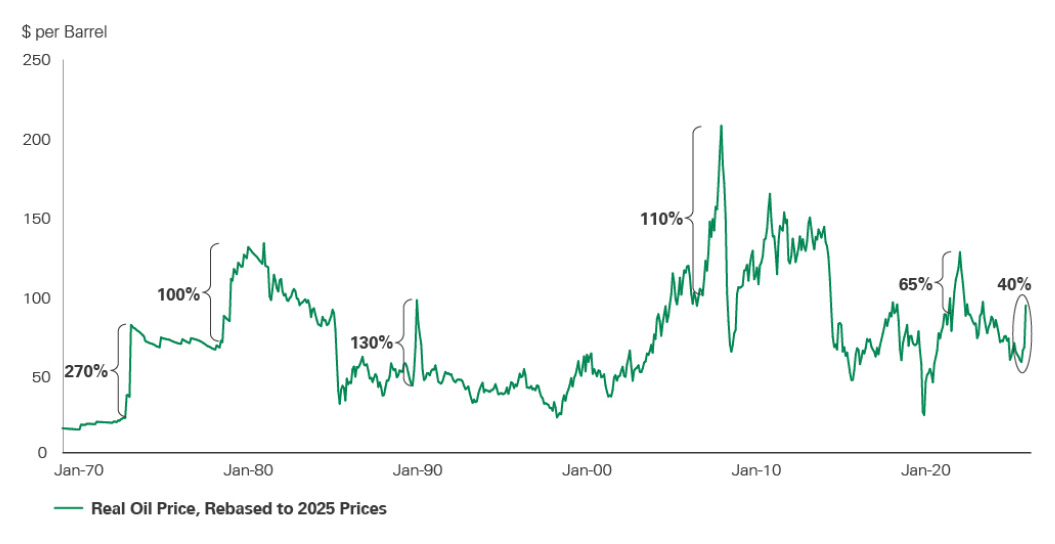
Exhibit 1: The Real Oil Price
Key takeaway: Oil prices, adjusted for inflation, have risen by roughly 40%, well below the 100%-or-more increases that have historically preceded economic downturns.
Key Takeaway: Oil prices, adjusted for inflation, have risen by roughly 40%, well below the 100%-or-more increases that have historically preceded economic downturns.
As of March 26, 2026.
Source: Bloomberg.
Oil price shocks are not unusual and, outside of recessions, have not typically coincided with significant equity market declines. Since the 1970s, there have been nine episodes in which oil prices rose by more than 100% over a year; four of these (1973, 1979, 1990, and 2007) preceded recessions. The 1970s were unique in that oil prices remained persistently elevated, offering limited relief to consumers, while transmission channels, from prices to wages, were stronger, allowing inflation expectations to become unanchored. Additionally, there were limited strategic reserves, and global production was less diversified. It is also worth noting that the 1980 recession was driven in part by credit controls under President Carter, which caused a sharp contraction in economic activity. Similarly, in the lead-up to the 1990–91 recession, higher oil prices were only one contributing factor alongside the savings and loan crisis, Fed tightening, commercial real estate oversupply, fiscal drag, and weakening employment.
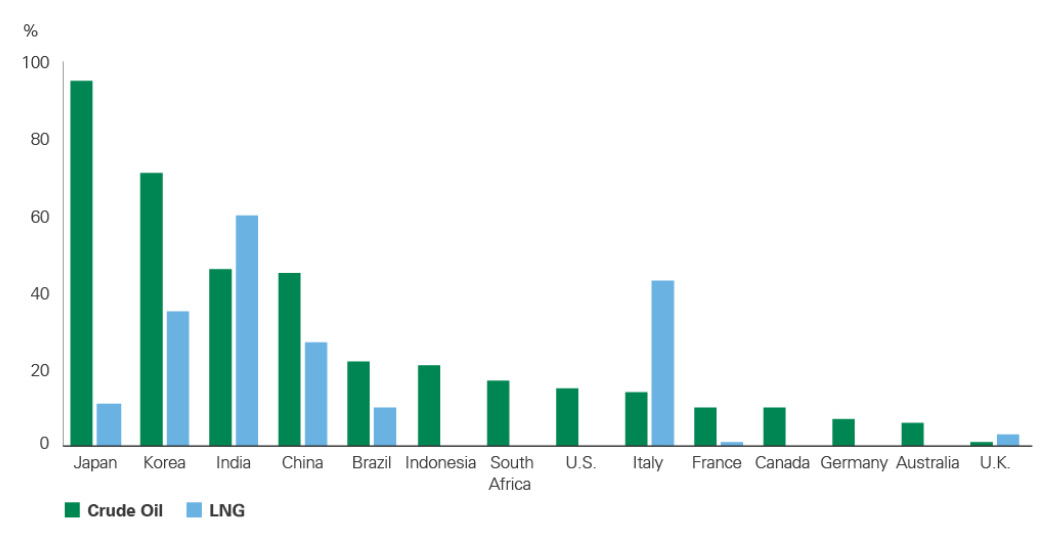
Exhibit 2: Share of Gulf Crude Oil and Natural Gas Imports, by Country
Key takeaway: U.S. energy consumption is relatively insulated from supply disruptions relative to other regions, particularly in natural gas.
Key Takeaway: U.S. energy consumption is relatively insulated from supply disruptions relative to other regions, particularly in natural gas.
As of March 23, 2026.
Source: Bloomberg.
More than half of U.S. crude oil imports come from Canada, with a smaller share of 15% sourced from the Gulf. The U.S. has also become one of the world’s largest producers of natural gas, with minimal reliance on Gulf countries. Domestic natural gas prices have remained relatively stable, in part because U.S. LNG export facilities were already operating near capacity prior to the conflict, limiting the ability to increase exports in the near term. In contrast, many Asian countries are highly exposed to disruptions due to their reliance on both crude and LNG shipments routed through the Strait. Some countries have declared national emergencies, while others are rationing fuel, releasing reserves, or encouraging energy conservation.
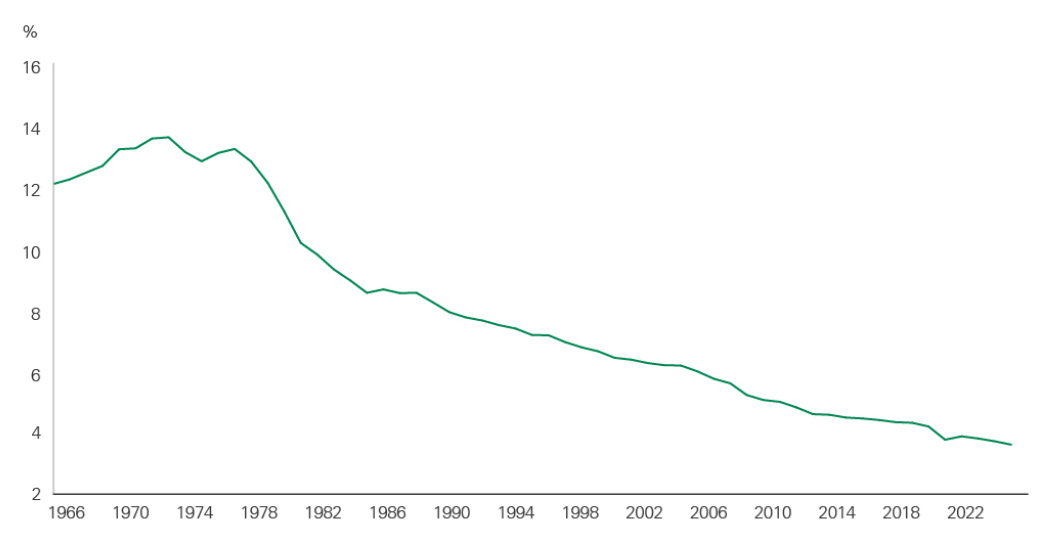
Exhibit 3: U.S. Oil Intensity
Key takeaway: The U.S. is much less dependent on oil than during past recessionary shocks, reflecting alternative energy sources, improved efficiency, and a shift toward services from goods-producing industries.
Key Takeaway: The U.S. is much less dependent on oil than during past recessionary shocks, reflecting alternative energy sources, improved efficiency, and a shift toward services from goods-producing industries.
As of December 31, 2024. Source: International Energy Agency, World Bank
The oil intensity of GDP, or the amount of oil required to produce a unit of economic output, has declined by more than 70% since the 1970s. Put another way, the U.S. economy has more than tripled in size while oil consumption has remained relatively stable. The share of consumer spending allocated to oil-related goods is near historic lows, at approximately 2.0%. Gains in energy efficiency, increased use of alternatives such as natural gas and renewable energy, and the transition toward a more service-oriented economy have all contributed to this reduced dependence. Average vehicle fuel efficiency has roughly doubled, and electric vehicle adoption reached a high of 10% of vehicle registrations in 2025. As a result, oil price shocks now tend to have a more limited impact on economic growth, particularly given the U.S.’s position as a net petroleum exporter.
Source: International Energy Agency, World Bank
The oil intensity of GDP, or the amount of oil required to produce a unit of economic output, has declined by more than 70% since the 1970s. Put another way, the U.S. economy has more than tripled in size while oil consumption has remained relatively stable. The share of consumer spending allocated to oil-related goods is near historic lows, at approximately 2.0%. Gains in energy efficiency, increased use of alternatives such as natural gas and renewable energy, and the transition toward a more service-oriented economy have all contributed to this reduced dependence. Average vehicle fuel efficiency has roughly doubled, and electric vehicle adoption reached a high of 10% of vehicle registrations in 2025. As a result, oil price shocks now tend to have a more limited impact on economic growth, particularly given the U.S.’s position as a net petroleum exporter.
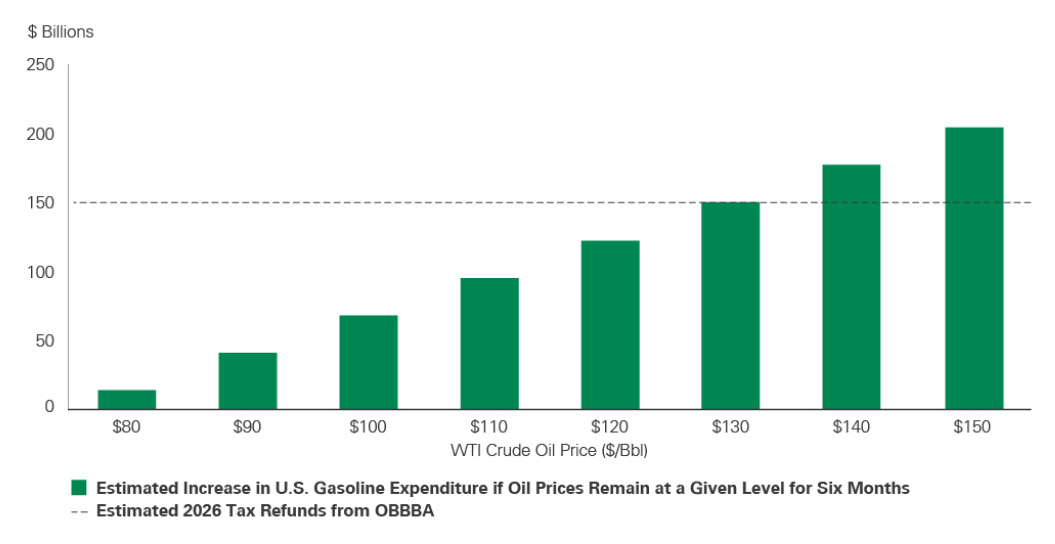
Exhibit 4: Consumer Tax Refunds Offset Higher Prices at the Pump
Key takeaway: Consumer tax refunds from the OBBBA provide a meaningful offset to higher gasoline costs, with the Congressional Budget Office (CBO) estimating a fiscal stimulus contribution of approximately 0.9% of GDP this year.
Key Takeaway: Consumer tax refunds from the OBBBA provide a meaningful offset to higher gasoline costs, with the Congressional Budget Office (CBO) estimating a fiscal stimulus contribution of approximately 0.9% of GDP this year.
As of March 26, 2026.
Source: Bloomberg, Strategas.
Changes to the tax code under the OBBBA are expected to generate a significant increase in tax refunds — roughly $150 billion through April. If oil prices remain at $100 per barrel for six months, less than 50% of these refunds would be offset by higher energy costs. Oil futures and IEA forecasts continue to suggest prices are likely to fall below $80 per barrel by year-end.
Compared to prior decades, the U.S. population is older, with individuals aged 55 and above accounting for roughly 40% of consumption. This cohort tends to be wealthier and less sensitive to economic cycles, though potentially more exposed to equity market fluctuations. Household balance sheets also remain strong, with debt service ratios near historic lows despite higher interest rates.
Exhibit 5: Strong Corporate Balance Sheets
Key takeaway: Corporate sector balance sheets remain healthy, supported by record-high profit margins, strong free cash flow, and low leverage.
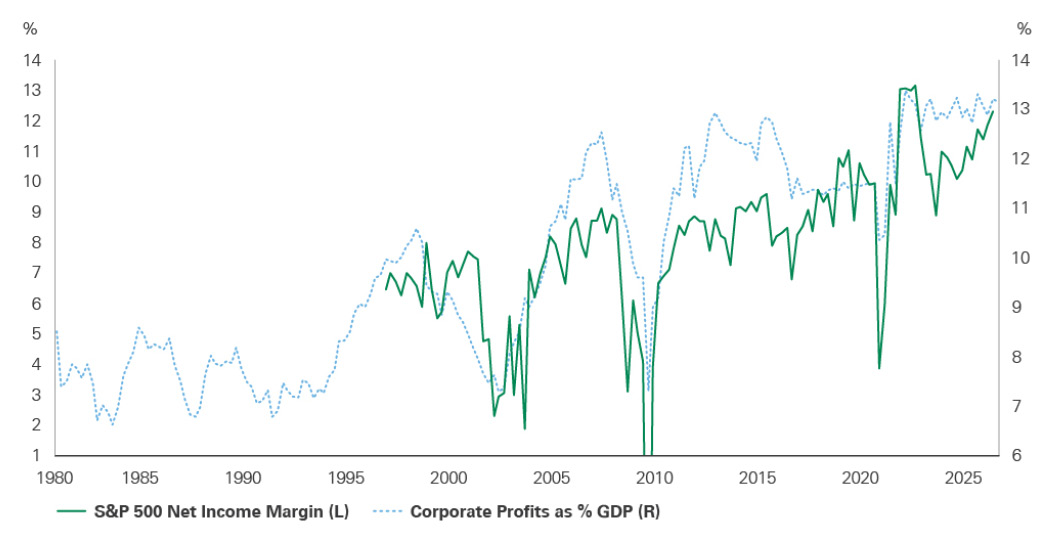
Key Takeaway: Corporate sector balance sheets remain healthy, supported by record-high profit margins, strong free cash flow, and low leverage.
As of December 31, 2025.
Source: Bloomberg, FactSet.
Corporate profit margins remain near record highs, as reflected in both national accounts data (NIPA profits) and S&P 500 companies. Net corporate debt levels have declined to the lowest levels since the mid-1980s, with debt service ratios nearing record lows, indicating limited pressure for deleveraging. U.S. corporate free cash flow remains positive, as measured by the corporate financing gap, supported by steady growth, past rate cuts, and easing lending standards. In order to drive large corporate deficits, which typically occur during recessions, some estimates suggest oil prices may need to rise closer to $200 per barrel.
The current AI-driven capital expenditure cycle, which is less sensitive to commodity price fluctuations, has the potential to support productivity gains and offset inflationary pressures. Historically, price shocks have also incentivized technological innovation. Combined with supportive fiscal policies, such as the full expensing of capital expenditures and R&D, these dynamics may further enhance firms’ ability to manage higher input costs.
Conclusion
Past oil shocks may be a less reliable guide to assessing the economic impact of higher oil prices today. The relationship between oil price increases and recessions is not strictly causal, and the structure of the U.S. economy has evolved in ways that reduce its sensitivity to commodity price shocks. This resilience supports maintaining a strategic overweight to U.S. equities as a defensive positioning. U.S. dollar appreciation since the onset of the conflict further reflects its safe-haven status and the relative strength of the U.S. economy. Bessemer portfolios remain overweight U.S. equities.
That said, oil remains a critical input across the global economy, influencing production costs, food prices, and products with limited substitutes such as aviation fuel. Low energy prices are key to sustaining economic expansion and productivity cycles, and no economy is entirely immune to sustained price increases. A reopening of the Strait of Hormuz is necessary to alleviate supply constraints and reduce upward pressure on energy prices.
Past performance is no guarantee of future results. This material is provided for your general information. It does not take into account the particular investment objectives, financial situations, or needs of individual clients. This material has been prepared based on information that Bessemer Trust believes to be reliable, but Bessemer makes no representation or warranty with respect to the accuracy or completeness of such information. This presentation does not include a complete description of any portfolio mentioned herein and is not an offer to sell any securities. Views expressed herein are current only as of the date indicated and are subject to change without notice. Forecasts may not be realized due to a variety of factors, including changes in economic growth, corporate profitability, geopolitical conditions, and inflation. The mention of a particular security is not intended to represent a stock-specific or other investment recommendation, and our view of these holdings may change at any time based on stock price movements, new research conclusions, or changes in risk preference.