Oil Markets in Five Pictures: What’s Driving Prices Now?

Oil prices have remained elevated despite a significant recovery in Middle East energy flows, raising an important question for investors: to what extent do current oil prices reflect underlying physical tightness versus a geopolitical risk premium?
The physical market provides some justification for higher prices, but the broader picture is more nuanced. Refined-product balances are tighter than crude balances, global economic activity remains relatively resilient, inventories have been drawn down, and supply remains vulnerable to renewed disruption. At the same time, global supply has recovered substantially as energy flows through the Persian Gulf have largely normalized, and the global oil supply-demand balance is still on track to return to surplus in early 2027.
This suggests that a meaningful portion of elevated prices may reflect a premium for geopolitical uncertainty rather than underlying physical shortages. For investors, that distinction matters. A risk premium can persist while uncertainty remains elevated — but it can also dissipate quickly in response to credible signs of de-escalation.
Crude oil prices have risen roughly 30% from the lows reached in late June and early July following the breakdown of the Islamabad Memorandum of Understanding between the U.S. and Iran. Since September, oil prices have averaged $95 per barrel, below their 2026 highs but still above pre-war levels.
Refined-product prices tell a somewhat different story (Exhibit 1). Gasoline prices remain close to their post-war highs, while diesel prices face even greater pressure, approaching record levels. Tighter product balances relative to crude explain this divergence. Refined-product supply has been slower to recover because of refinery outages and disruptions. Demand has remained relatively resilient, with recent measures exceeding five-year averages. Diesel demand is particularly inelastic given its close ties to economic activity and recent support from government measures.
Exhibit 1: West Texas Intermediate (WTI) Crude Oil Prices vs. Refined-Product Prices
Key takeaway: Crude oil prices remain below post-war highs but above pre-war levels, while refined-product prices face greater upward pressure due to a tighter physical market.
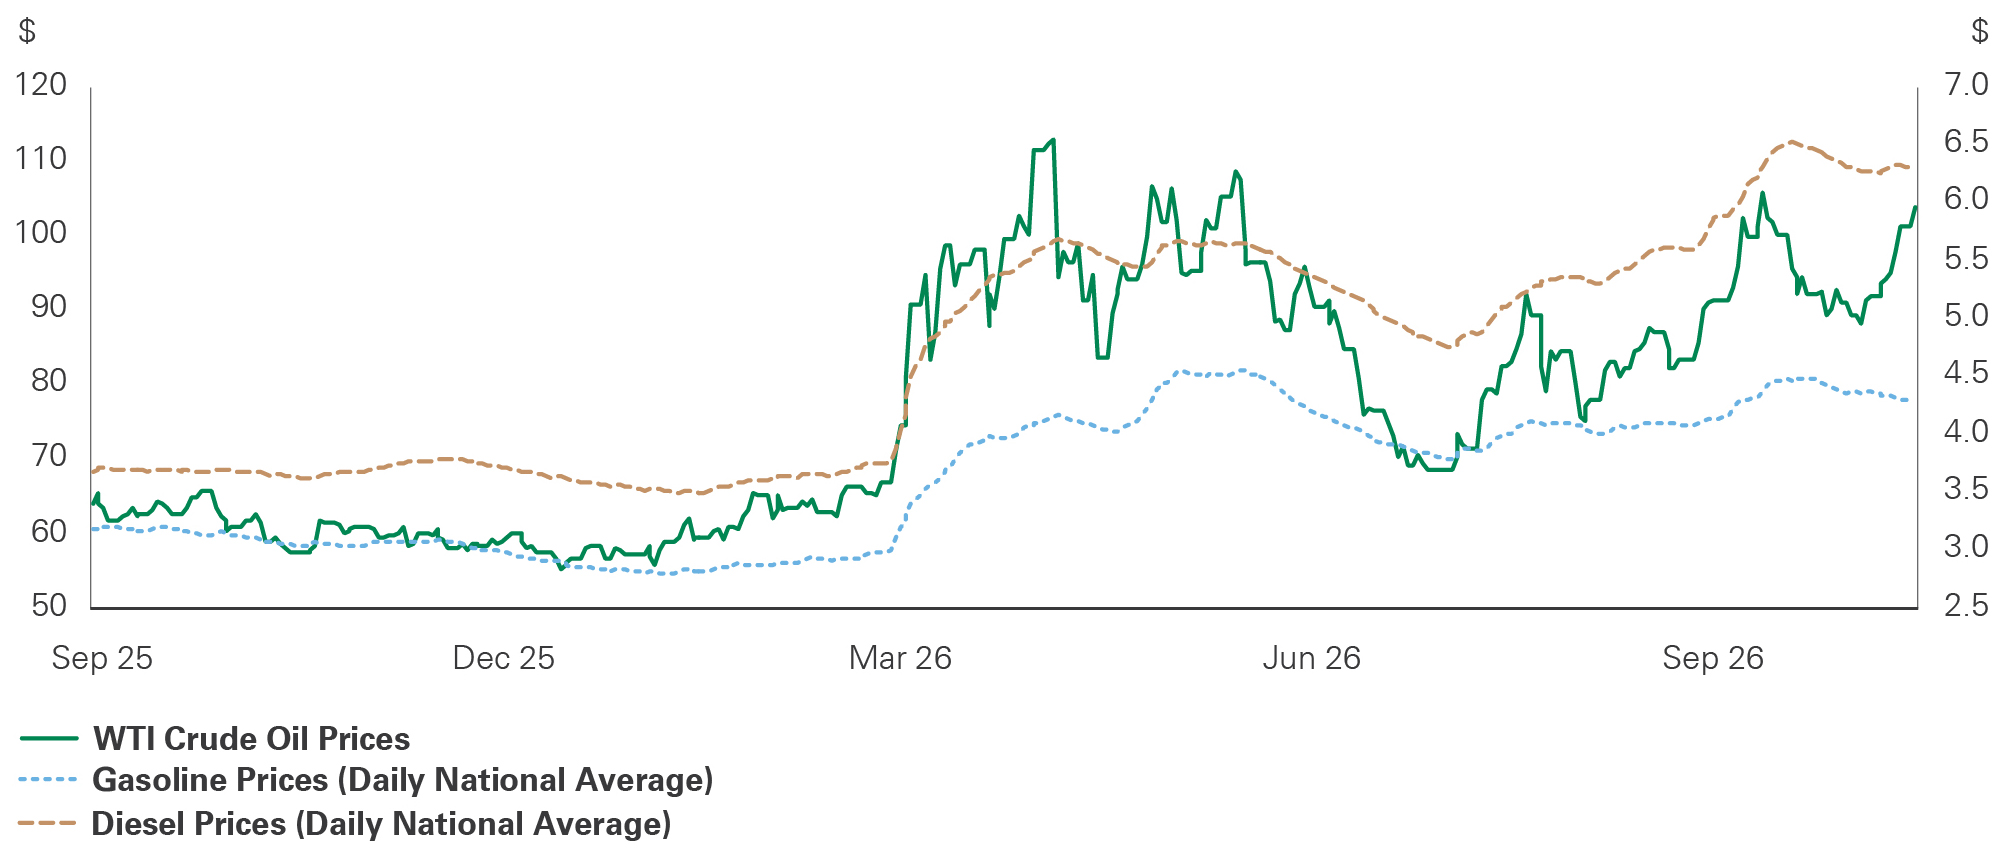
Line chart comparing West Texas Intermediate crude oil prices with daily national-average gasoline and diesel prices from September 2025 through October 15, 2026, using separate dollar scales. Prices rise sharply in early 2026 before easing and then recovering. Crude oil remains below its post-war highs but above pre-war levels. Gasoline prices remain close to their post-war highs, while diesel prices approach record levels. The divergence reflects tighter supply-demand conditions for refined products than for crude oil.
One notable development in energy markets has been the recovery in Middle East energy flows despite the ongoing conflict. Persian Gulf exports of crude and refined products have recovered to approximately 23 million barrels per day (mb/d), compared with a 2025 average of 24.6 mb/d (Exhibit 2). This is notable given that Iranian exports — roughly 2 mb/d before the war — have effectively disappeared, while flows through the Strait of Hormuz remain below pre-war levels. Increased flows through the Red Sea and Gulf of Oman, combined with the rapid restoration of East-West pipeline capacity, have largely offset the reduction in volumes transiting the Strait of Hormuz.
Exhibit 2: Supply — Persian Gulf Oil Exports
Key takeaway: Elevated oil prices obscure a substantial recovery in Persian Gulf exports, which have nearly normalized to their 2025 average.
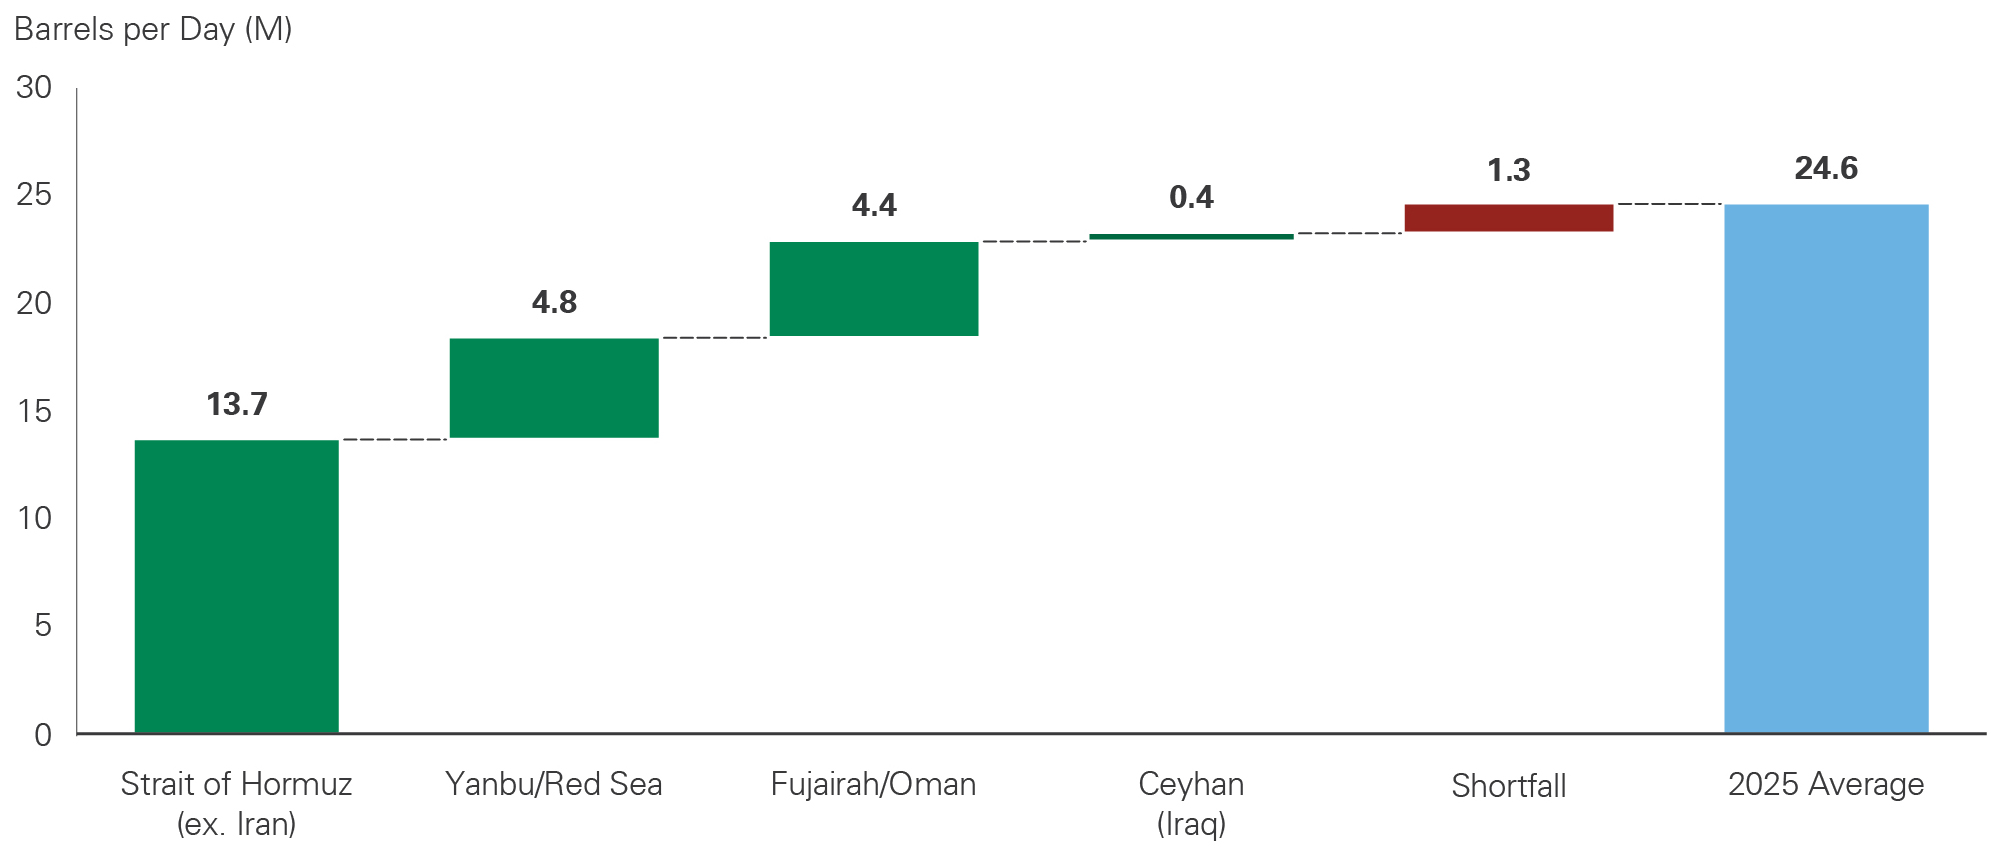
Waterfall chart showing Persian Gulf oil exports by route as of September 30, 2026, measured in millions of barrels per day. Exports include 13.7 through the Strait of Hormuz, excluding Iran; 4.8 through Yanbu/Red Sea; 4.4 through Fujairah/Oman; and 0.4 through Ceyhan (Iraq). A shortfall of 1.3 million barrels per day separates these combined flows from the 2025 average of 24.6 million. The chart highlights a substantial recovery in exports, with alternative routes helping offset reduced flows through the Strait of Hormuz. 10_21_26_BT_TL_Inv_OilMarketsIn…
Overall crude exports have surpassed 2025 levels, whereas refined-product exports remain roughly 30% below their 2025 average. This divergence is consistent with the tighter refined-product market described above and helps explain why diesel and other refined products remain under greater pressure than crude.
The crude market has therefore demonstrated considerable capacity to reroute supply and restore production. Global oil supply, led by Gulf producers, increased by approximately 2.5 mb/d in September to 102.3 mb/d, compared with 96.4 mb/d in the second quarter of 2026.
In this scenario where supply has recovered, the other explanation for elevated crude prices would be stronger-than-expected demand. However, the evidence for this is less compelling.
China has been an important source of demand weakness, weighing on oil prices since the onset of war. Since June, Chinese oil imports have recovered by roughly 2 mb/d but remain well below the levels seen from 2023 through 2025 (Exhibit 3). Chinese refinery runs also remain subdued. The recent Trump-XI summit, which resulted in an extension of the U.S.-China trade truce, suggests China could continue to cooperate and restrain its oil imports.
Exhibit 3: Demand — China Monthly Oil Imports
Key takeaway: Chinese imports remain subdued though demand conditions do not appear to be driven by oil price movements.
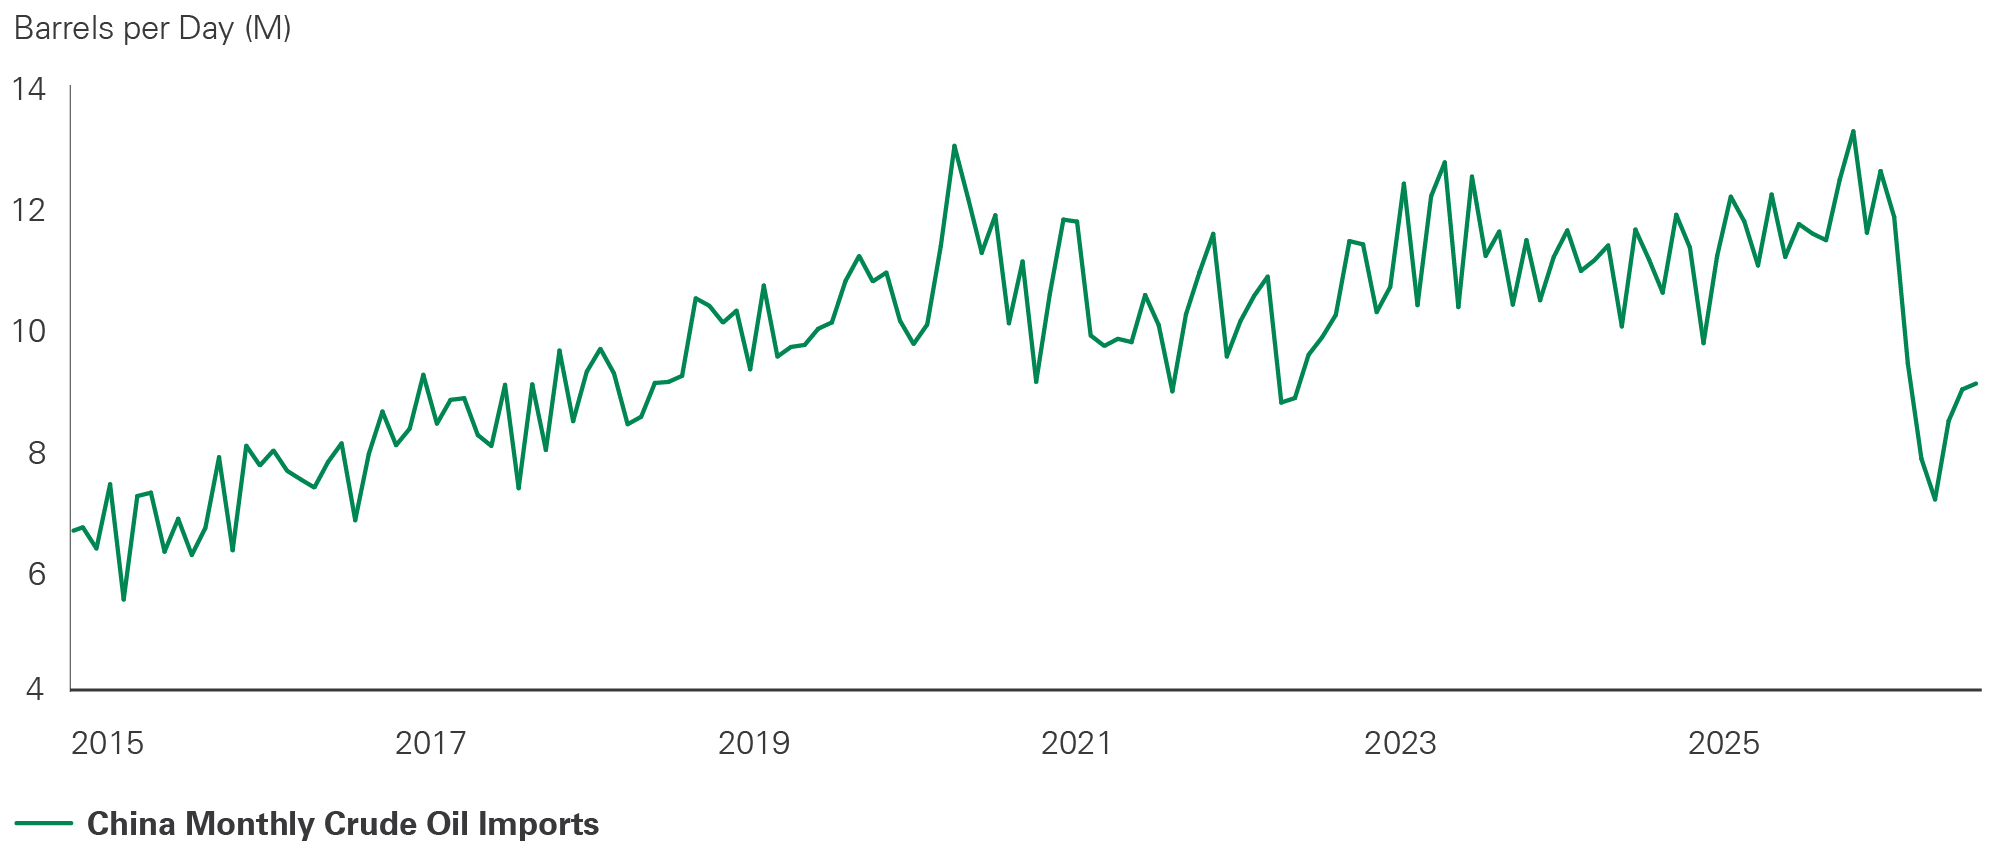
Line chart showing China’s monthly crude oil imports from 2015 through September 2026, measured in millions of barrels per day. Imports generally increase from approximately 6–7 million in 2015 to around 10–13 million during 2023–2025, with substantial monthly fluctuations. In 2026, imports fall sharply to approximately 7 million before recovering to around 9 million. Despite the rebound, imports remain below their 2023–2025 levels. The accompanying takeaway notes that Chinese imports remain subdued and demand conditions do not appear to be driven by oil-price movements.
General Administration
Elsewhere, demand conditions in the U.S. and Europe — two of the world’s largest oil-importing regions — have been relatively resilient. Nevertheless, decomposition analysis suggests that supply-side developments remain more influential than demand-side factors when explaining recent price movements.
Alongside recovering supply, global crude balances are still expected to remain in deficit through year-end, although the market has loosened considerably and is on track to return to surplus in 2027.
With supply recovering and demand providing only limited support, a geopolitical risk premium appears to be an important factor sustaining elevated oil prices.
Emergency reserve releases have also played an important role in moderating price increases since the onset of the war. In March, the International Energy Agency authorized the release of approximately 400 million barrels from emergency reserves, with the U.S. providing the largest contribution. These releases have helped cushion the initial supply disruption and reduced the need for higher crude prices to curb demand.
However, the effectiveness of this buffer is diminishing. U.S. Strategic Petroleum Reserve (SPR) withdrawals are slowing, while global commercial inventories are approaching historically low levels (Exhibit 4). Although energy flows are normalizing, the inventory cushion available to absorb another disruption has narrowed considerably. This helps explain why the market continues to price a premium into crude oil even as physical flows recover.
Exhibit 4: Oil Inventories and the Geopolitical Risk Premium
Key takeaway: Elevated oil prices likely reflect a significant geopolitical risk premium, reinforced by declining inventories and the ongoing potential for supply disruptions.
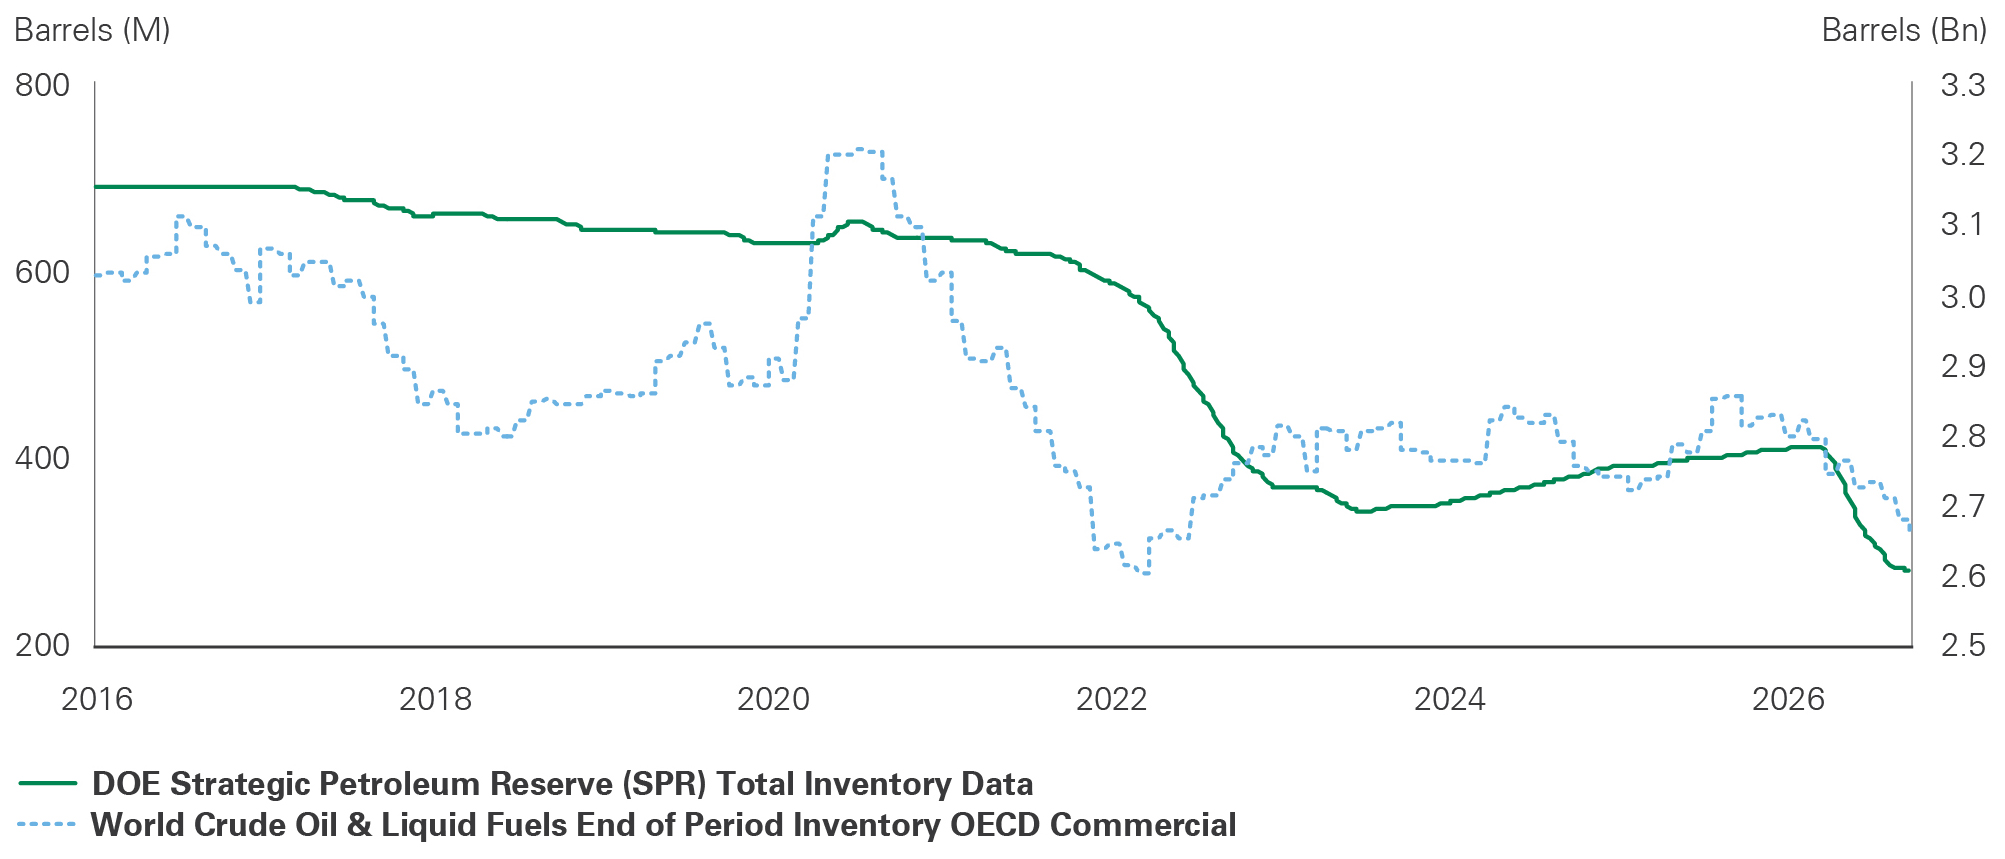
Dual-axis line chart showing U.S. Strategic Petroleum Reserve inventories in millions of barrels and OECD commercial crude oil and liquid-fuel inventories in billions of barrels from 2016 through September 2026. Strategic reserves decline sharply during 2022, partially recover, and fall again in 2026. Commercial inventories peak around 2020, decline substantially, and finish near the lower end of the period shown. The shrinking inventory cushion leaves less protection against renewed supply disruptions. The exhibit identifies declining inventories and ongoing disruption risks as factors reinforcing a likely geopolitical risk premium in oil prices.
Markets also appear to be assigning a meaningful probability to the possibility that the recovery in energy flows will prove temporary. Attacks on commercial shipping remain a concern. While President Trump has not ruled out military strikes, he has indicated they would not occur before the November midterm elections. Market-based indicators also suggest that investors anticipate an extended period of geopolitical uncertainty. Since August, prediction-market odds of a U.S.-Iran nuclear agreement before 2027 have remained below 20%, while markets have assigned a greater-than-even probability to U.S. military action before December.
Expectations of a prolonged conflict may therefore be contributing to demand for inflation protection, with investors using oil as a hedge against potential future disruptions. This dynamic is also reflected in volatility. The CBOE crude oil volatility index remains elevated relative to pre-war levels, although it has declined substantially from the extreme readings recorded in March and April.
Persistently high oil prices present two important stagflationary risks: greater pass-through to consumer inflation and weaker demand as higher energy costs weigh on economic activity. So far, however, the pass-through to consumers has been limited (Exhibit 5), while domestic demand has remained resilient. Estimates suggest that higher energy prices will add only a modest 20 basis points to core inflation (excluding food and energy), primarily through higher airfares. Meanwhile, consumer spending is on track for another robust quarter with an annualized growth of 3% in the third quarter.
Exhibit 5: Oil Pass-Through — Producer Price Inflation vs. Consumer Inflation
Key takeaway: Persistently elevated gasoline and diesel prices increase inflation risks and support the Federal Reserve’s continued bias toward rate hikes. However, we expect the pass-through to core consumer prices to remain limited.
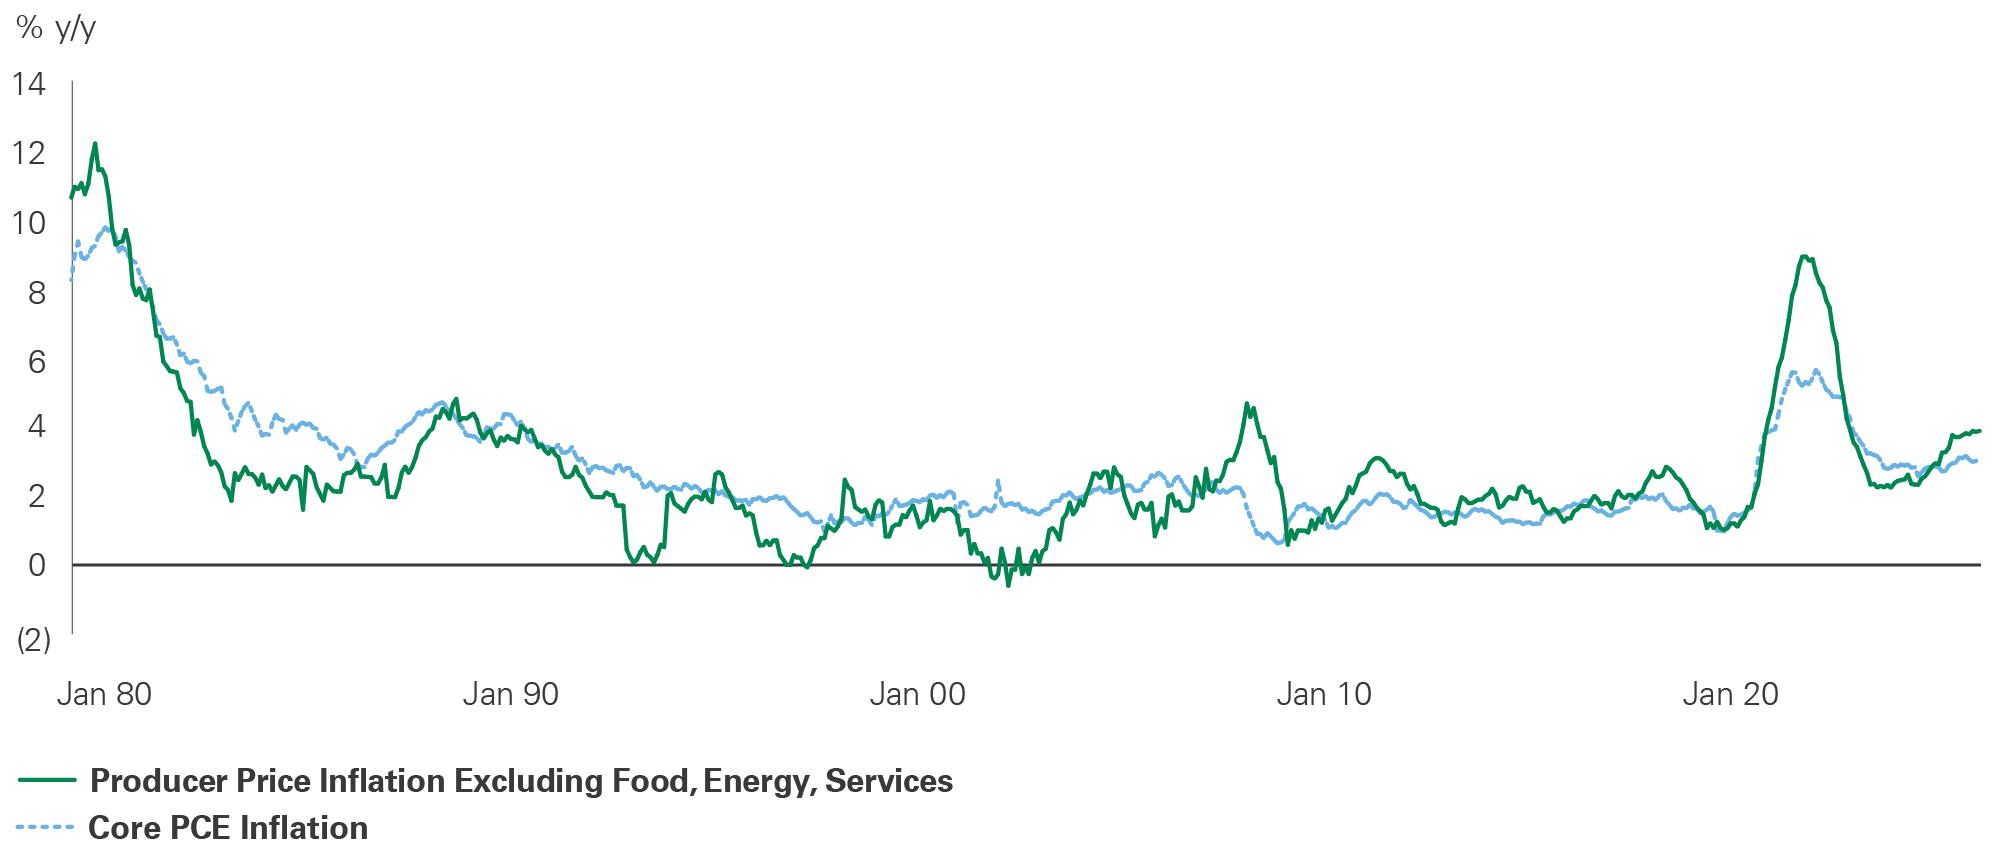
Line chart comparing year-over-year producer price inflation, excluding food, energy, and services, with core personal consumption expenditures (PCE) inflation from around 1980 through September 2026. Producer inflation shows greater volatility, including larger spikes in the early 1980s and during the inflation surge following 2020. Core PCE inflation follows a smoother path. Both measures decline from their recent peaks before turning higher near the end of the period. The exhibit highlights inflation risks from elevated gasoline and diesel prices but expects their pass-through to core consumer prices to remain limited.
Labor Statistics
For the Federal Reserve (the Fed), the greater concern is the potential for more broad-based inflation, especially if demand conditions stay resilient. Elevated diesel prices pose a particular risk, as diesel accounts for roughly 70% of oil inputs used by firms. Producer prices are therefore more sensitive to changes in diesel prices than consumer prices are, whereas the impact on consumer prices is less certain and likely to remain limited in the short term. Goods prices are most exposed, but account for only a quarter of core PCE, the Fed’s preferred inflation gauge. We continue to expect the fading effect of tariffs to be the dominant influence on goods inflation. Nonetheless, elevated energy prices are likely to reinforce the Fed’s bias toward further rate hikes, provided demand stays resilient.
Conclusion
Physical supply-demand fundamentals alone do not fully explain why crude oil prices have remained elevated above $90 per barrel. Markets are likely attaching a significant geopolitical risk premium. This suggests that if the conflict persists, that premium could remain elevated for an extended period. Conversely, credible signs of meaningful de-escalation could prompt a rapid compression of the risk premium, even before physical market conditions adjust.
At the same time, underlying physical market conditions remain vulnerable. Crude balances are still in deficit, refined-product balances are tighter, inventories are low, and the ongoing conflict leaves supply exposed to renewed disruption. A prolonged conflict could further increase the market’s vulnerability to supply disruptions. Persistently elevated gasoline and diesel prices also pose growing inflation risks and remain an important reason we expect additional rate hikes. Refined product markets are also likely to take longer to adjust following any conflict resolution. We remain overweight equities with an underweight to consumer discretionary given continued pressure on the consumer. We will continue to monitor the evolution of the conflict and implications for energy markets, inflation, and monetary policy.
Past performance is no guarantee of future results. This material is provided for your general information. It does not take into account the particular investment objectives, financial situations, or needs of individual clients. This material has been prepared based on information that Bessemer Trust believes to be reliable, but Bessemer makes no representation or warranty with respect to the accuracy or completeness of such information. This presentation does not include a complete description of any portfolio mentioned herein and is not an offer to sell any securities. Views expressed herein are current only as of the date indicated and are subject to change without notice. Forecasts may not be realized due to a variety of factors, including changes in economic growth, corporate profitability, geopolitical conditions, and inflation. The mention of a particular security is not intended to represent a stock-specific or other investment recommendation, and our view of these holdings may change at any time based on stock price movements, new research conclusions, or changes in risk preference.