Metals Rally Amid U.S. Dollar Depreciation

Gold and other precious metals prices have surged in the past year — a rally unlike anything we have seen in decades. At the same time, the U.S. dollar has declined relative to a basket of other currencies, though the magnitude of its downward move pales in comparison to the increase in metals.
One prevailing market narrative is that this reflects dollar debasement driven by persistent fiscal deficits, eroding confidence in the credibility of the Federal Reserve, and a foreign selldown of U.S. assets due to geopolitical risk.
These risks are no doubt real and may help explain some of the moves in the dollar and gold, but there appears to be more to the story than a simple debasement trade. For one, the U.S. dollar moves through cycles of strength and weakness over time and is negatively correlated to economic activity and risk appetite, both of which have increased from the lows experienced during the aggressive rate hikes of 2022. We also do not see other signs of debasement that one would expect to be present, as bond yields, inflation expectations, and equity markets are all behaving reasonably.
The magnitude of the move in gold — both in absolute terms and relative to the move in the dollar — combined with the fact that other metals, such as silver, are participating in this exponential surge in prices, points to something that is not being driven by fundamentals. In fact, the incremental buyer of precious metals appears to be individual investors buying ETFs, most of which are listed and purchased in the U.S. In the following sections, we aim to provide additional context and data to help paint a more complete picture.
At Bessemer, we avoid direct exposure to commodities in our strategic asset allocation — in large part because commodities do not generate cash flow. Instead, their prices are driven by supply and demand dynamics. From our perspective, this has two important implications. First, commodity prices are often not driven by fundamentals and are therefore difficult to value and to compare to equities and bonds; and second, they do not benefit from compounding over time, which detracts from long-term returns. Commodities can do well in short time horizons and at times provide beneficial diversification, but over the long term, they tend to exhibit bond-like returns with equity-like volatility or higher, as seen in Exhibit 1.
Exhibit 1: Long-Term Risk and Return
Key takeaway: Over the long term, commodities have generated lower returns with higher volatility compared to their stock counterparts.
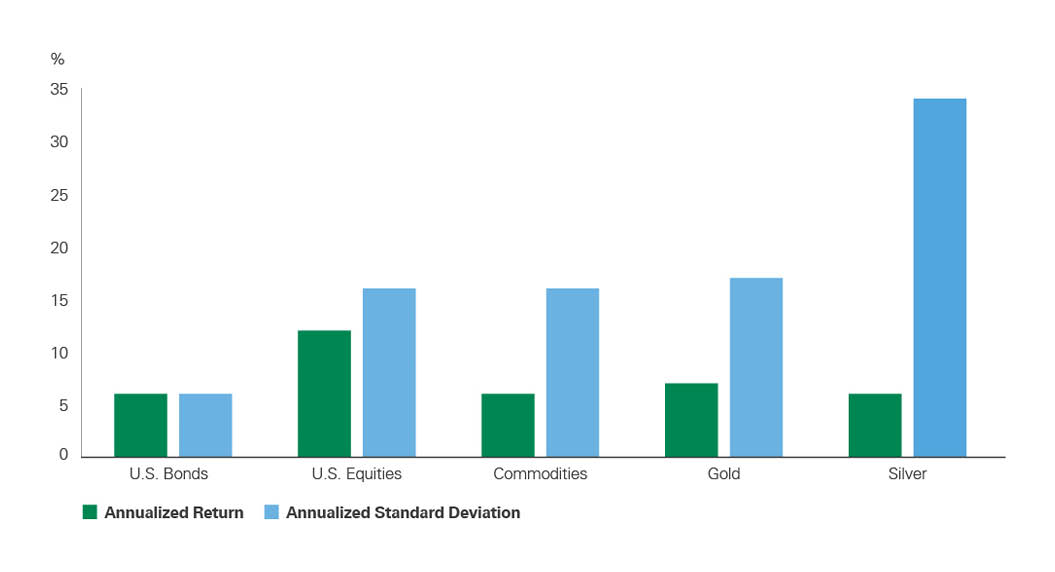
Bar chart showing annualized returns versus annualized standard deviation for major asset classes. U.S. equities generate the highest return at approximately 12% with moderate volatility near 16%. Silver shows the highest volatility at roughly 34% with lower returns near 6%. Gold and commodities occupy the middle ground, while U.S. bonds deliver the lowest volatility and lowest return. The chart illustrates the strategic risk–return tradeoffs across traditional and real assets.
Instead, we prefer portfolio exposure to equities for growth and inflation protection, and to fixed income for income generation and diversification. Portfolios can get indirect exposure to commodities by owning the stock or bonds of companies exposed to commodities, or via alternatives such as real assets or hedge funds.
When we invest in a gold mining company, for example, we are investing in a business that can be evaluated using the same discipline applied to other equity investments, analyzing metrics such as margins, balance sheet strength, management quality, and capital allocation. A mining company would also generate ongoing cash flows that can be reinvested or returned to shareholders, and ultimately, these cash flows will compound, which a direct investment in gold cannot do.
The U.S. dollar has historically acted as a safe-haven currency, tending to strengthen during periods of economic and market uncertainty and weaken as the global economy and markets stabilize or improve. As seen in Exhibit 2, from late 2021 to late 2022, economic activity deteriorated sharply as central banks aggressively raised interest rates to combat inflation (as evidenced by the green line moving lower). In this environment, investors sought safety, and the dollar strengthened significantly against a broad basket of currencies (blue line sharply increasing). Since then, the global economy has normalized, with inflation rates falling toward central bank targets and economic growth improving. In this environment, appetite for haven currencies such as the dollar has diminished, while demand for riskier currencies and assets has increased. The recent decline in the dollar therefore appears cyclical and driven by economic conditions, and the absolute level of the dollar is in line with averages since the global financial crisis.
Exhibit 2: U.S. Dollar vs. Global Economic Activity
Key takeaway: Recent U.S. dollar depreciation reflects a normalization of economic conditions, in our view.
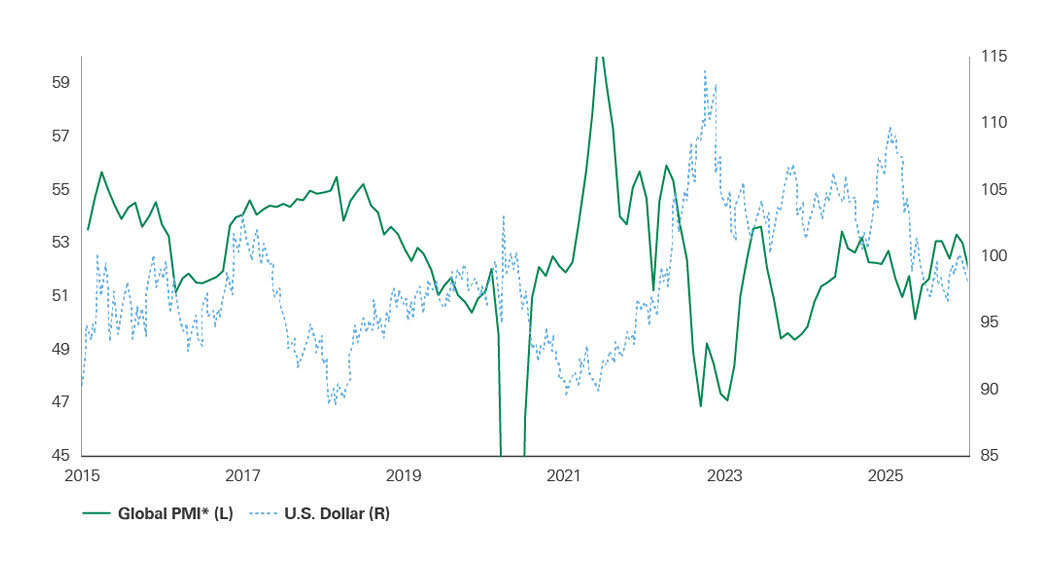
Dual-axis line chart comparing Global Purchasing Managers’ Index (PMI) on the left axis and the U.S. dollar index on the right axis from 2015 to 2025. Global PMI reflects economic cycles, including a sharp downturn in 2020 and recovery in 2021. The U.S. dollar generally strengthens during periods of weaker PMI, highlighting the inverse relationship between global growth momentum and dollar performance.
As of December 31, 2025. Source: Bloomberg, FactSet, S&P Global
If true U.S. dollar debasement were underway, we would expect to see several developments that currently are not occurring. First, the dollar decline would likely be much more pronounced. Second, inflation expectations and U.S. bond yields would likely be sharply rising. If the U.S. were materially riskier today, whether due to fiscal or geopolitical concerns, investors would begin to price in a higher risk premium. And if the Federal Reserve had lost credibility, inflation expectations would rise, which would in turn push bond yields higher. Bitcoin and other crypto assets are also down over this period, despite this potentially being a moment to highlight the benefit of decentralized currencies not tied to a central bank. While Exhibit 3 may appear uneventful, that stability is also the point.
Exhibit 3: U.S. Bond Yields and Inflation Expectations
Key takeaway: Stable long-term bond yields and inflation expectations do not point to dollar debasement.
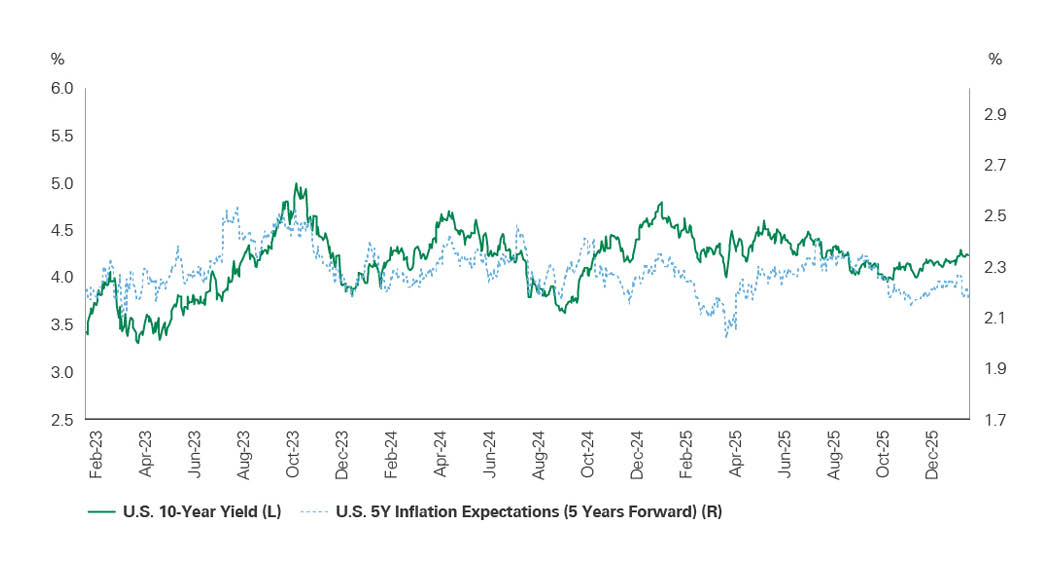
Dual-axis line chart from early 2023 through late 2025 showing the U.S. 10-year Treasury yield on the left axis and 5-year forward inflation expectations on the right axis. Both measures rise through 2023 and stabilize thereafter, illustrating evolving real rate conditions and market-based inflation expectations that shape the investment backdrop for real assets.
The price of gold, as with other commodities, is primarily driven by supply and demand. Prices can rise when there is an unexpected decrease in supply or an increase in demand, and vice versa. According to the World Gold Council, while annual supply of physical gold was largely unchanged in 2025 at 5,000 tons, annual demand increased by about 300 tons. Demand from jewelry fabricators, technology companies, and central banks all declined in 2025 relative to the year prior. At the same time, demand increased in the investment category, and the increase was entirely driven by ETFs and other financial products. The daily trading volume in U.S.-listed ETFs, whose prices are based on the prices of precious metals, also exploded in this period. Exhibit 4 shows the daily trading volume in SLV, a U.S.-listed ETF that tracks the price of silver. Looking back 20 years, the average volume per day is about $16 million. On January 30, 2026, that figure reached $510 million in a single day. Despite headlines suggesting a surge in buying from central banks or foreign pension plans, the data shows that the marginal buyer has primarily been ETFs. This suggests that much of the price action is being driven by news flow trading activity.
Exhibit 4: Daily Trading Volume in Precious Metals ETFs Has Surged
Key takeaway: The recent rise in silver prices was driven more by speculation than by fundamentals.
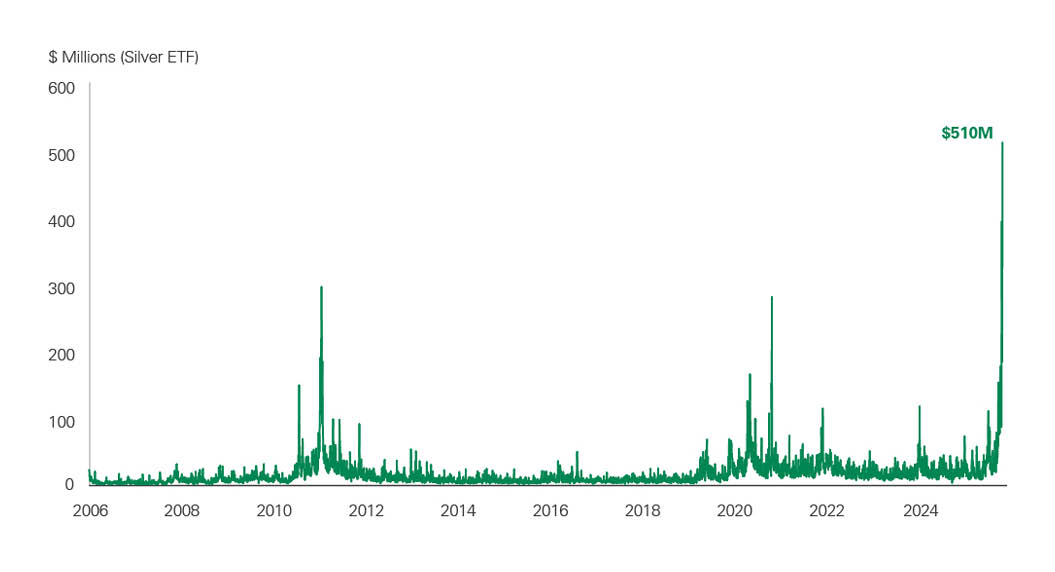
Time-series chart displaying silver ETF fund flows in millions of dollars from 2006 through 2025. While most periods show modest flows, there are pronounced spikes during periods of market stress or reflationary momentum, including major surges around 2011, 2020, and a record inflow of approximately $510 million in 2025, signaling renewed investor demand for silver exposure.
Exhibit 5, which shows inflation-adjusted movements in the prices of gold and silver, provides two key lessons. First, these precious metals are not always reliable stores of value. Both have lost value on an inflation-adjusted basis for extended periods. The post-COVID inflation surge of 2021-2022 is a recent period in which neither gold nor silver acted as the inflation hedge they are often assumed to be. Second, we have seen correlated metals rallies before, and they have typically not ended well. Silver, in particular, is often viewed as a speculative metal when it surges to the extent it has recently. Silver is also not seen as a safe haven, like gold, and central banks do not use it as a reserve asset. When the gold-silver price ratio declines sharply, as it has during this rally, it is typically a sign of speculative behavior.
Exhibit 5: History Repeating
Key takeaway: Gold and silver have shown mixed effectiveness as inflation hedges over time.
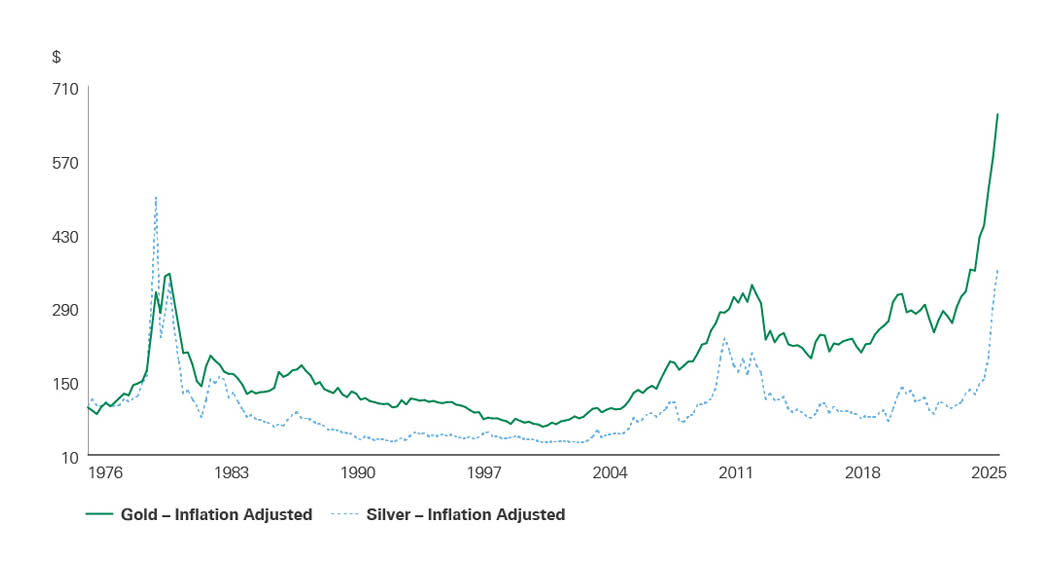
Long-term line chart showing inflation-adjusted prices of gold and silver from the mid-1970s through 2025. Gold exhibits steadier long-term appreciation with peaks around 1980, 2011, and a new high in 2025. Silver displays greater volatility with sharper cyclical swings and a strong recent upswing. The chart underscores differing risk and return profiles within precious metals over long horizons.
A Speculative Rally, Not a Structural Shift
We believe the dollar’s depreciation is being driven largely by an improving economic backdrop, falling interest rates, and rising investor risk appetite. If these trends continue, the dollar may weaken further in typical cyclical fashion. Expanding fiscal deficits and questions around Federal Reserve credibility do present long-term risks — but if those were the primary drivers of dollar weakness today, we would likely see signs in the bond market or in inflation expectations. So far, we do not. We will continue to monitor the situation.
As rates fall and dollar asset yields decline, gold can benefit. It would also benefit from true dollar debasement and fear. However, the magnitude of the move in gold and silver, combined with the significant increase in ETF activity, suggests that this rally in metals is, in part, news-driven speculative trade — not one anchored in fundamentals. That said, Bessemer portfolios can still benefit from the recent rally through exposure to companies in affected industries, such as gold miners or financial exchanges.
Past performance is no guarantee of future results. This material is provided for your general information. It does not take into account the particular investment objectives, financial situations, or needs of individual clients. This material has been prepared based on information that Bessemer Trust believes to be reliable, but Bessemer makes no representation or warranty with respect to the accuracy or completeness of such information. This presentation does not include a complete description of any portfolio mentioned herein and is not an offer to sell any securities. Views expressed herein are current only as of the date indicated and are subject to change without notice. Forecasts may not be realized due to a variety of factors, including changes in economic growth, corporate profitability, geopolitical conditions, and inflation. The mention of a particular security is not intended to represent a stock-specific or other investment recommendation, and our view of these holdings may change at any time based on stock price movements, new research conclusions, or changes in risk preference.