Our Approach to International Equities Amid a Continued U.S. Bias
- While we remain overweight U.S. equities in our portfolios, we believe it’s important to remain open to investment opportunities abroad. Targeted exposure outside of the U.S. provides a larger universe of potential opportunities for active managers. Also, maintaining long-term exposure to non-U.S. equities has historically reduced volatility when compared to an all-U.S. portfolio.
- In the near term, we continue to see select opportunities outside of the U.S., particularly those related to artificial intelligence, healthcare innovation, and infrastructure spending. Careful active management is essential, in our view.
- In this Investment Insights, we review the macroeconomic outlooks and investment prospects for Japan, India, Europe, and China, as well as the reasons why we maintain our significant overweight to the U.S.
Bessemer portfolios currently have a significant overweight to the U.S., with 76% of our All Equity portfolio allocated domestically relative to the benchmark exposure of 63% (Exhibit 1). Although our U.S. overweight has always been a feature of our portfolios, the magnitude of our overweight to the U.S. has increased in recent years — in 2016, our overweight relative to the All Equity benchmark stood at 5% versus a 13% overweight today. Our U.S. overweight has added four percentage points to our overall All Equity performance over the past five years. We remain comfortable with this heavy overweight as we believe several structural advantages provide for the most compelling investment opportunities (for more on this, see “Why We Remain Overweight the U.S.” below).
Exhibit 1: Bessemer All Equity Regional Weights
Key takeaway: Bessemer portfolios maintain a heavy overweight to the U.S., but with one quarter of our portfolios invested in companies outside of the U.S. and close to half of revenues generated abroad, we continue to focus on select opportunities internationally.
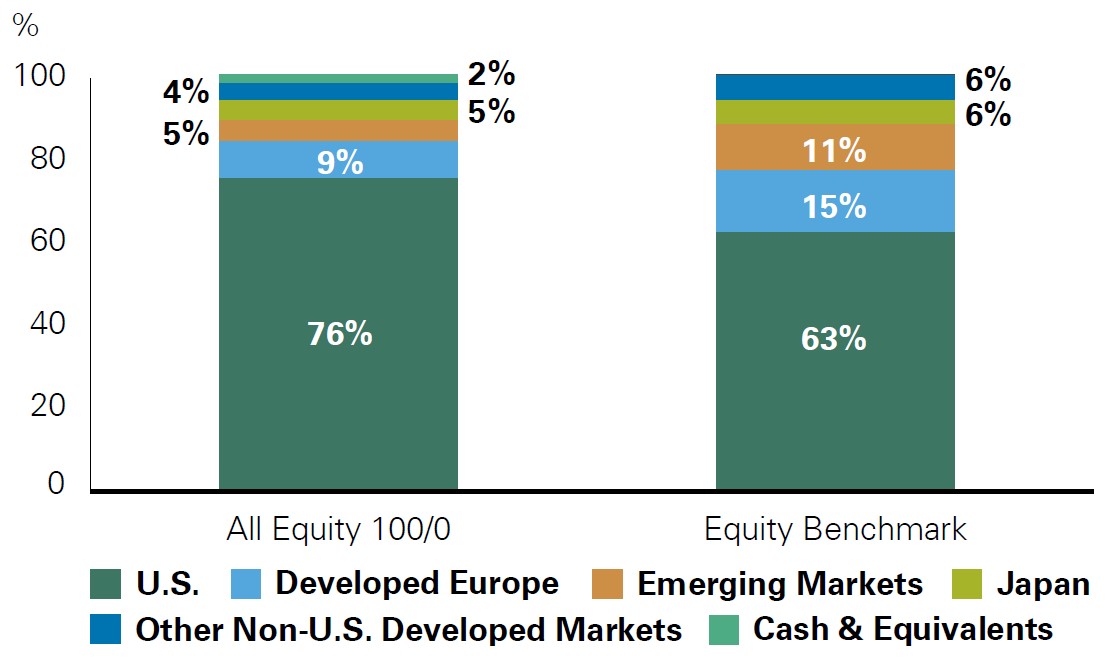
Exhibit 1: Bessemer All Equity Regional Weights
Key Takeaway: Bessemer portfolios maintain a heavy overweight to the U.S., but with one quarter of our portfolios invested in companies outside of the U.S. and close to half of revenues generated abroad, ample time is spent focusing on opportunities internationally.
Exhibit 1 is a bar chart that examines regional asset allocation of the Bessemer All Equity Portfolio versus its MSCI All Country World IMI benchmark – U.S. (73% for the All Equity Portfolio vs 63% for the benchmark), Developed Europe (9% vs 15%), Emerging Markets (5%vs 11%), Japan (5% vs 6%), Other Non-U.S. Developed Markets (4% vs 6%), and cash and equivalents (2% vs.6).
The numbers for the All Equity Portfolio are as of July 31, 2024. Figures may not sum to 100% due to rounding. “Other Non-U.S. Developed Markets” includes Canada, Israel, and Asia Pacific ex-Japan. The Equity Benchmark represents the MSCI All Country World IMI. Source: Bessemer Trust
Source: Bessemer Trust
U.S. equities have outperformed their developed international market peers by an average of 21% on a rolling 3-year basis since 2010, and they have done so with less volatility. Given this recent performance history, why do we allocate internationally?
The simple answer is that, over time, leadership rotates (Exhibit 2). Although it can be tempting to allocate even more heavily away from international markets, diversification allows our portfolios to participate when there is strength outside of the U.S.
Exhibit 2: 3-Year Rolling Returns for U.S. vs. Non-U.S. Developed Markets (Indexed to 100 in 1970)
Key takeaway: Though we have seen an extended period of U.S. outperformance, global leadership rotates over time.
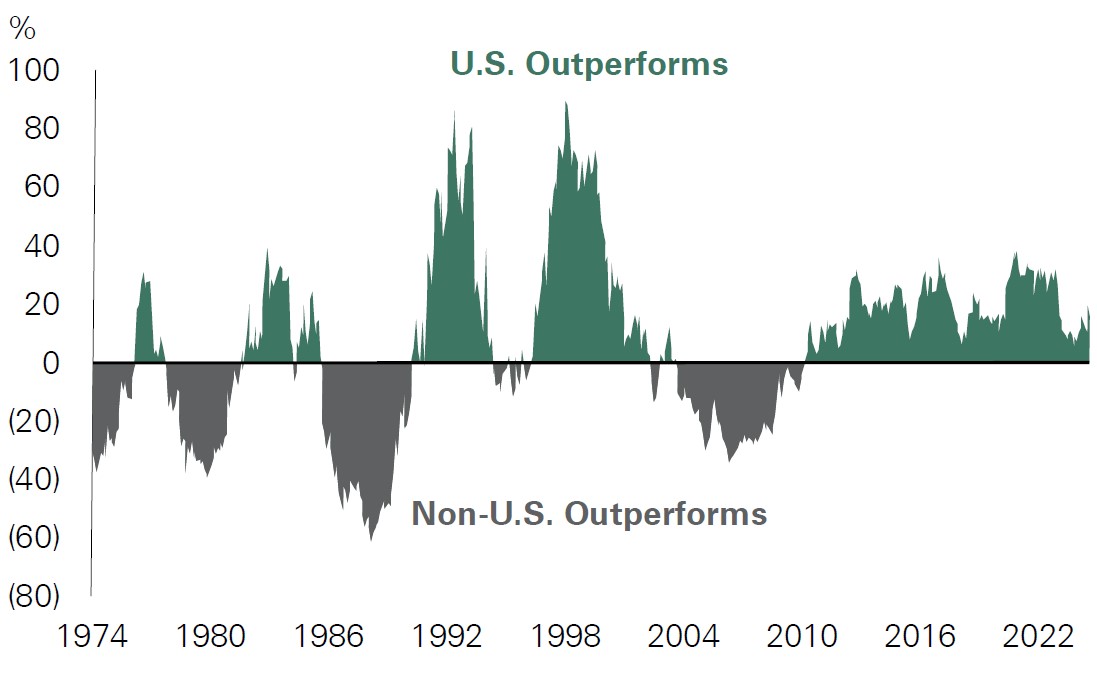
Exhibit 2: 3-Year Rolling Returns U.S. vs. Non-U.S. Developed Markets (Indexed to 100 in 1970)
Key Takeaway: Though we have seen an extended period of U.S. outperformance, global leadership rotates over time.
Exhibit 2 is a line graph that depicts the frequent leadership change in outperformance of U.S. and non-U.S. markets.
As of July 31, 2024. U.S. utilizes MSCI USA and Developed Non-U.S. utilizes MSCI EAFE. Source: Bloomberg
Source: Bloomberg
Given our active approach, we are not just looking for index-like returns abroad. For context, within our global and purely international strategies, those that we’ve invested in for five years or more have outperformed their respective benchmarks by an average of 1.7% per year.
Additionally, investing internationally can help reduce overall portfolio volatility, with a 70/30 U.S./international equity portfolio producing an average annual volatility of 14.3% versus 15.3% for an all-U.S. portfolio.
Including international equities can also reduce potential tail risk associated with sector concentration. Over 40% of the S&P 500 is comprised of technology and communication services companies. Using the above 70/30 U.S./international equity example, the resultant portfolio reduces the sector concentration to 26%, while maintaining the same level of historical risk-adjusted return as an all-U.S. portfolio.
The Importance of Active Management
When investing outside of the U.S., we believe active management is essential. While high-quality companies are abundant in the U.S., such opportunities are not as plentiful in international markets (Exhibit 3). This is reflected in a return on equity (a financial metric that measures the profitability of a company in relation to shareholder’s equity) that is much lower outside the U.S. The return on equity for the MSCI USA index has averaged 17.3% over the last five years, while the MSCI World ex. U.S. index has averaged 10.9%. This can indicate how effectively a company is using money invested by its shareholders to generate profits. Even with a much higher percentage of quality companies in the U.S., many top performing stocks within the global benchmark are from companies domiciled outside the U.S. (Exhibit 4). This underscores the importance of looking for opportunities in international markets, while also being highly selective via careful analysis of each company.
Exhibit 3: The Percentage of High-Quality Companies Within Regional Stock Market Indices
Key takeaway: The U.S. has a notably higher proportion of high-quality companies relative to developed international and emerging markets.
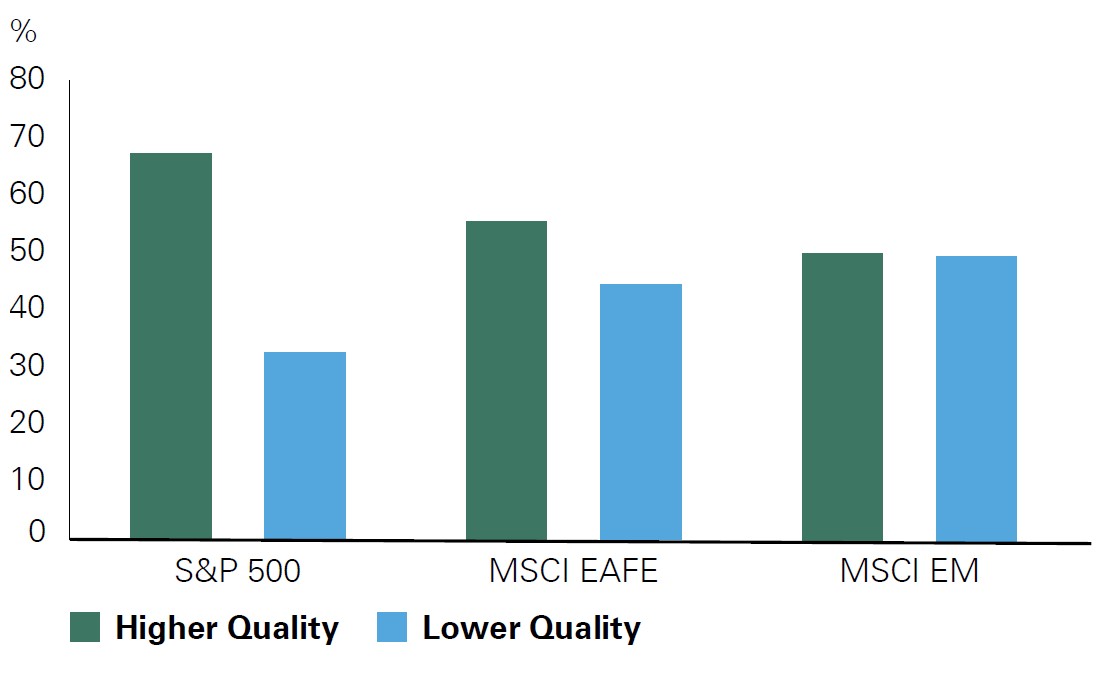
Exhibit 3: The Percentage of High-Quality Companies Within Regional Stock Market Indices
Key Takeaway: The U.S. has a notably higher proportion of high-quality companies relative to developed international and emerging markets.
Exhibit 3 is a bar chart that compares higher-quality and lower-quality companies in the S&P 500, MSCI EAFE, and MSCI EM. The S&P 500 has a higher percentage of higher quality companies than the other indices.
As of July 31, 2024. The MSCI EAFE region covers developed market countries in Europe, Australia, Asia, Israel, and the Far East. MSCI EM covers emerging markets. High-quality companies are defined by Bessemer internal models, which look at various measures of quality including return on equity, free cash flow to sales, return on investment capital, earnings durability, and other factors.
Source: Bessemer Trust, FactSet
Exhibit 4: The Top 10 Percentile Return for Non-U.S. Stocks vs. Average U.S. Stock Returns (MSCI ACWI)
Key takeaway: Many top performing stocks within the global benchmark are domiciled outside of the U.S., but active management is essential given the higher percentage of low-quality companies.
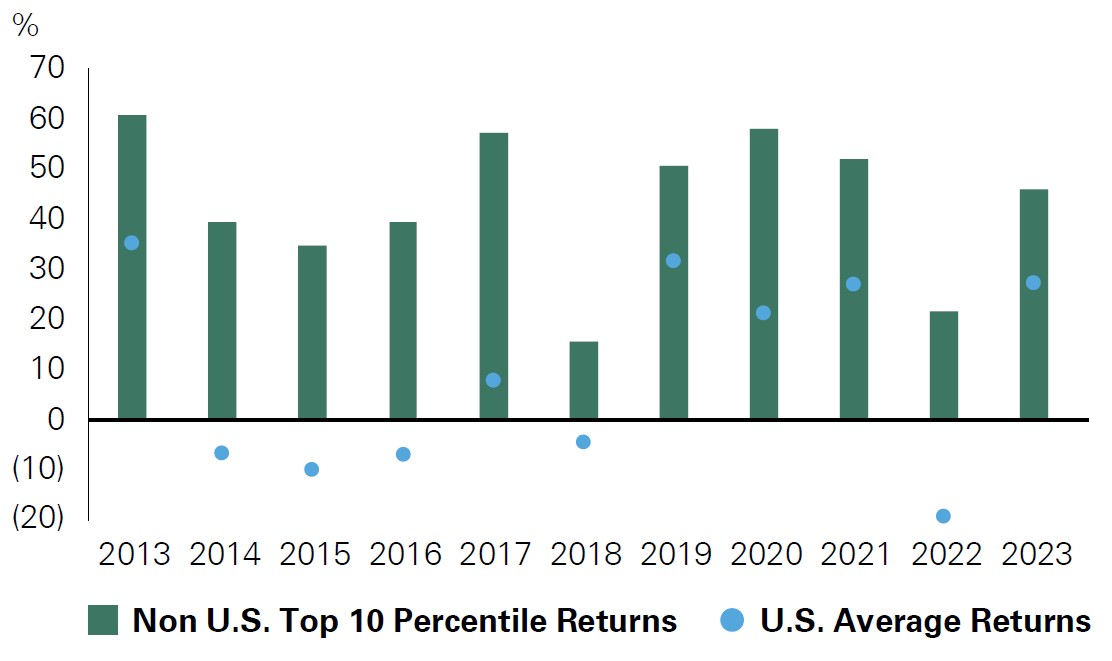
Exhibit 4: The Top 10 Percentile Return for Non-U.S. Stocks vs. Average U.S. Stock Returns (MSCI ACWI)
Key Takeaway: Many top performing stocks within the global benchmark are domiciled outside of the U.S., but active management is essential given the higher percentage of low-quality companies.
Exhibit 4 is a bar chart that compares the return of the top 10 percentile non-U.S. stocks within the global benchmark versus the average U.S. stock returns in the MSCI ACWI. In each of the past 10 years, the return of these top non-U.S. stocks was noticeably better than the average return of U.S. stocks.
As of December 31, 2023. Data is pulled from the MSCI ACWI. Non-U.S. returns are calculated in their local currency. Source: FactSet
Source: FactSet
In some instances, the macroeconomic backdrop can be favorable, creating even more reason to look for active opportunities within a certain region. For Japan and India, there are various macroeconomic shifts and tailwinds that we believe can support the equity market; some examples include the exit of deflation in Japan and favorable demographics in India. Notably, reshoring trends are likely to benefit both countries in the coming years.
Japan
In the 1990s, Japan accounted for 40% of the world stock market; today, it represents roughly 6%. While it comprises a smaller portion of our benchmarks, the dynamic macroeconomic backdrop has commanded more of our attention. Although performance has been volatile in recent weeks (and years), the Japanese equity market has several emerging tailwinds. We divide the areas of focus into the 3Rs: reflation, reforms, and reshoring.
Reflation. Above-target inflation has returned to Japan for the first time in a decade. While parts of the world are fighting off inflation, in Japan, moderate inflation is viewed as a positive. Earnings are reported in nominal terms, so moderate inflation can often aid corporate profits. Additionally, households in Japan are flush with cash relative to their developed market peers after years of underinvestment in equities; paired with the loss of purchasing power as inflation increases, this dynamic should encourage investment in the equity market (Exhibit 5). Wage growth has also recently been supported by the largest increase in the minimum wage in the last 30 years. In turn, we believe consumption and nominal growth will continue to be supported. For the first time in two years, real wage growth has turned positive, which should underpin domestic consumption, as seen by the first increase in five quarters in private consumption.
Exhibit 5: Currency and Deposits as a Percentage of Total Household Financial Assets
Key takeaway: Relative to their developed market peers, households in Japan have ample cash on their balance sheets that can be deployed in the equity market to offset inflation.
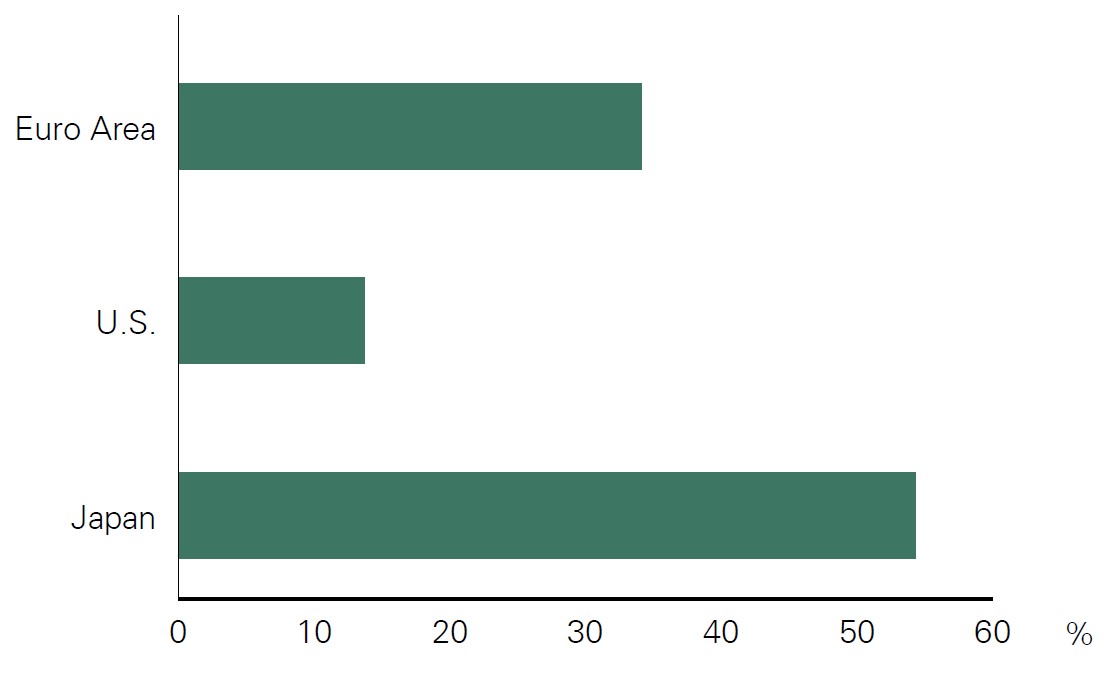
Exhibit 5: Currency and Deposits as a Percentage of Total Household Financial Assets
Key Takeaway: Relative to their developed market peers, households in Japan have ample cash on their balance sheets that can be deployed in the equity market to offset inflation.
Exhibit 5 is a bar chart that compares current available cash for households in Japan (roughly 55%), the euro area (roughly 35%), and the U.S. (roughly 15%).
As of December 31, 2023. Source: Bank of Japan, European Commission, Federal Reserve Board 0 10 20 30
Source: Bank of Japan, European Commission, Federal Reserve Board
Reforms. Corporate reforms mandated by the Tokyo Stock Exchange (TSE) in recent years have pressured Japanese corporations to improve the cost of capital and profitability in a sustainable manner. The TSE is seeking to change the culture of companies primarily by emphasizing greater profitability, capital allocation, and corporate governance, in part by leveraging peer pressure to push companies to enact reforms. Currently, companies in Japan have substantial unproductive capital on their balance sheets, particularly in real estate, and some aspects of corporate reforms are aimed at monetizing and reinvesting these assets to improve return on equity. Also, rising investment limits for tax-exempt investment accounts called Nippon Individual Savings Accounts (NISA) can push domestic investors toward the Japanese equity market.
Reshoring. Japan also stands to benefit from global supply chain diversification away from China. At one point, Japan comprised 50% of the global chip manufacturing market but has declined to around 13% today. The government has provided support equivalent to 0.71% of GDP to bolster domestic chip manufacturing as companies look for alternatives to China.
Given the tailwinds present in Japan, we have increased our overall exposure within the All Equity portfolio to 4.4%, up from 2.3% at the start of the year, but we have maintained our underweight. We have also increased our exposure to financials in Japan (for example, Mitsubishi UFJ Financial Group) as interest rate hikes from the BOJ (Bank of Japan) are likely to support bank earnings following an extended period of negative interest rates. Bessemer portfolios also have exposure to Tokyo Electron, which can benefit as the government supports domestic chip manufacturing.
We are cognizant of recent risks associated with the unwind of the yen carry trade. For years, investors have borrowed at zero rates in Japanese yen and invested those funds in higher yielding assets outside of Japan. A recent sharp reversal in yen weakness as the Bank of Japan increased interest rates caused panic and a consequent unwinding of these positions, leading to global market volatility and a massive sell-off in Japanese stocks. Since then, the BOJ has assured markets that further rate increases are not imminent, calming equity investors and helping the stock market recover from the selloff.
India
Having surpassed China in 2023, India is now the most populous country in the world with more than 1.4 billion inhabitants. India’s population is also growing at a much faster rate than that of the U.S. and China, and some projections show that India could have close to double China’s population by 2075. While the median age in China and the U.S. is around 40 years, India’s population is much younger with a median age of 29.5 years. Moreover, India now produces more than 2.5 million college graduates with STEM degrees per year, the second highest number in the world (Exhibit 6). While the overall education system in India is still behind those of neighboring East Asian countries, there are now more than five million computer related engineers in India. As a result, India has the capacity to help absorb information technology related work that is shifting out of China.
Exhibit 6: STEM Graduates per Country (2020)
Key takeaway: As technology related manufacturing shifts toward India, the population is well equipped given its technical expertise.
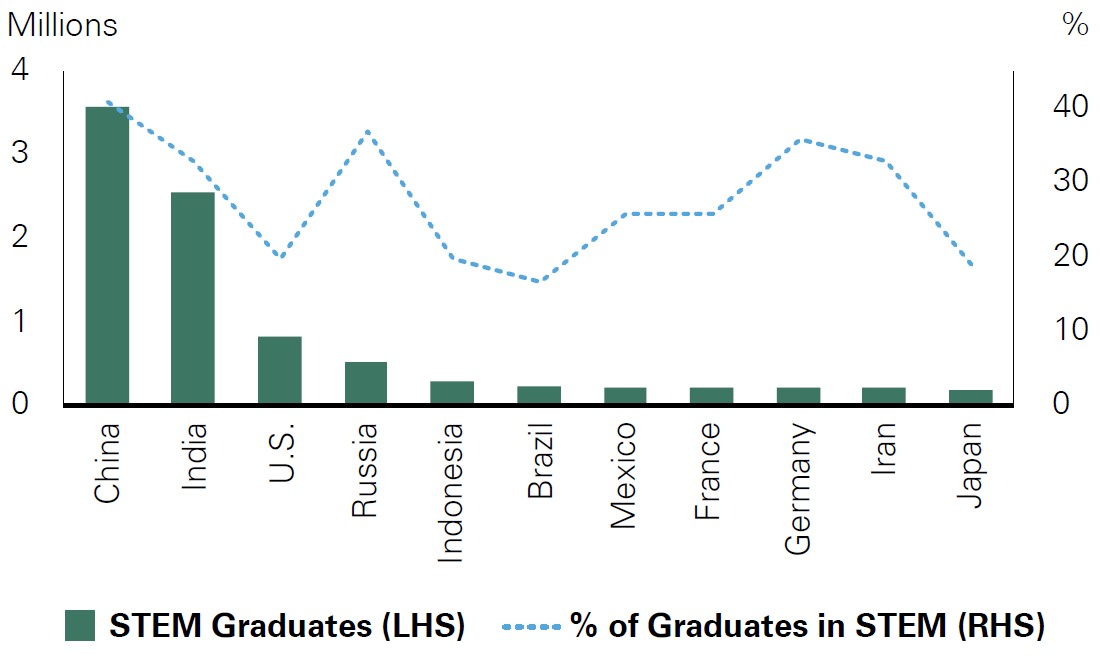
Exhibit 6: STEM Graduates per Country (2020)
Key Takeaway: As technology related manufacturing shifts toward India, the population is well equipped given its technical expertise.
Exhibit 6 is a bar chart that illustrates the number of STEP graduates in Japan, Iran, Germany, France, Mexico, Brazil, Indonesia, Russia, the United States, India, and China. India is second only to China, and those top two are graduating significantly more STEM graduates than all of the other countries.
As of: December 31, 2020. STEM stands for Science, Technology, Engineering, and Mathematics. Source: Center for Security and Emerging Technology
Source: Center for Security and Emerging Technology
India is also on the precipice of transitioning from a low-income country into a moderate-income country. Currently, India’s GDP per capita of $2,731 is far below that of Mexico and China. As a result, there is a lot of room for India’s standard of living to quickly catch up. For example, the number of people earning more than $10K U.S. dollars (USD) is expected to increase by 67% over the next four years. As the number of middle-income earners grows dramatically over the next few years, consumption of goods and services such as education, healthcare, and recreation should rise substantially.
The Indian government with Prime Minister Narendra Modi has heavily emphasized increasing the country’s manufacturing capacity, which coincides with Western countries shifting production out of China. Recent initiatives include increasing iPhone and semiconductor manufacturing capacity. The government has rolled out a $36 billion production incentive plan (PLI) that pays domestic and multinational corporations bonuses for manufacturing a certain quantity of items within India. Bonuses are allocated to a wide variety of categories, including EV batteries, solar panels, IT hardware, and pharmaceuticals. Many of the current economic initiatives — such as incentivizing foreign direct investment, lowering corporate taxes, and turning India into a global manufacturing hub — are still likely to continue in the next administration.
At the same time, investing in India is not without risks. In India, the regional and local governments have more relative power, so broad central government mandates and initiatives do not necessarily get results as quickly or, in some cases, at all. For example, new infrastructure projects have made more progress in Mumbai than in Bangalore. In addition, worker education levels, quality, and mobility can vary widely across regions. Many Indian workers prefer to work near their hometowns, so production is less scalable in India than it is in China.
Within Bessemer’s portfolios, some of our external large cap managers have meaningful overweight positions in India. Among the key investment themes are the increasing personal consumption of durable goods, healthcare, and financial services. For example, about 23% of the Indian population does not use banks, a far higher percentage than that of the U.S. and China. So as Indians become wealthier and their standard of living rises, we anticipate that their use of financial services will also significantly increase, which should benefit major banks such as Bessemer holding HDFC Bank.
When investing outside of the U.S., we are often faced with headwinds from a macro perspective, but we can still find select opportunities. While this will not influence our overall investment view from a top-down perspective, investment opportunities are present, particularly those that relate to structural themes. Below, we detail areas that remain attractive in Europe and China despite a challenging macroeconomic backdrop.
Europe
The overall macroeconomic picture in Europe is likely to remain challenged, in our view. While peak restrictive monetary policy is behind the eurozone as the ECB (European Central Bank) began its rate cutting cycle in June, interest rate levels are still restraining growth. The eurozone, being a net energy importer, is more susceptible to the effects of geopolitical instability compared to the U.S., which is a net exporter of energy. Additionally, weakness from China can flow through to the eurozone since it is one of the region’s largest trading partners. If the elected U.S. president enacts more protectionist policies toward China, the eurozone could be negatively impacted.
But there is a bright spot in Europe: the consumer. The labor market is now structurally tighter, which has led to positive real wage growth as inflation has declined, a dynamic that should support consumption. Consumption comprises 55% of GDP growth, so this impact is not to be understated.
Bessemer portfolios are underweight the eurozone, but we have found targeted exposure in companies that relate to structural themes. Given the potential strength of the wealthier consumer, we have exposure to high-end luxury companies within the eurozone — for example, LVMH. We also have exposure to ASML Holding N.V., which holds a strong competitive advantage in the semiconductor supply chain that enables the production of smaller and more efficient chips. Although there are geopolitical concerns about regulations related to semiconductor equipment shipments to China, ASML’s share of revenue from China is set to decrease over the coming years. Additionally, Bessemer portfolios have exposure to healthcare innovation within Europe in areas such as GLP-1 drugs. Bessemer portfolios have exposure to Novo Nordisk, one of the two top players in the diabetes and obesity space.
China
China has the second highest GDP in the world at more than 18 trillion USD. However, the country has recently struggled from a demographics-driven supply and demand mismatch.
Housing development and land sales had been a major source of local government revenue for many years, but now, with a declining population, a large surplus of excess housing has resulted in a long-term property market slump. According to China’s National Bureau of Statistics, in February 2024, the country’s unsold residential floor space reached an all-time record of 8.1 billion square feet. As real estate constitutes a much bigger part of GDP and household wealth in China than in the U.S., the housing downturn has negatively impacted consumer spending.
Geopolitics will also continue to be a key uncertainty, and recent trends suggest the economic decoupling between the U.S. and China will be both ongoing and bilateral. Police raids on the offices of U.S. management consulting firms, the banning of Apple iPhones for Chinese government officials, and the prohibition of SOEs (state-owned enterprises) from using U.S. Big Four accounting firms are some examples that demonstrate China is also trying to decouple from the U.S. due to national security concerns.
While China’s overall economy may continue to struggle, there are still many sectors with exciting growth trajectories. For example, China is now the world’s largest producer of electric vehicles (EVs) given its dominance in battery production, the most complex area of the supply chain (Exhibit 7), and solar panels. More importantly, China’s digital economy is expected to become an increasingly large percentage of total GDP, particularly in the areas of e-commerce, streaming media, and online banking.
Exhibit 7: Top 10 Countries for EV Battery Manufacturing
Key takeaway: Two-thirds of global EV battery manufacturing occurs in China.
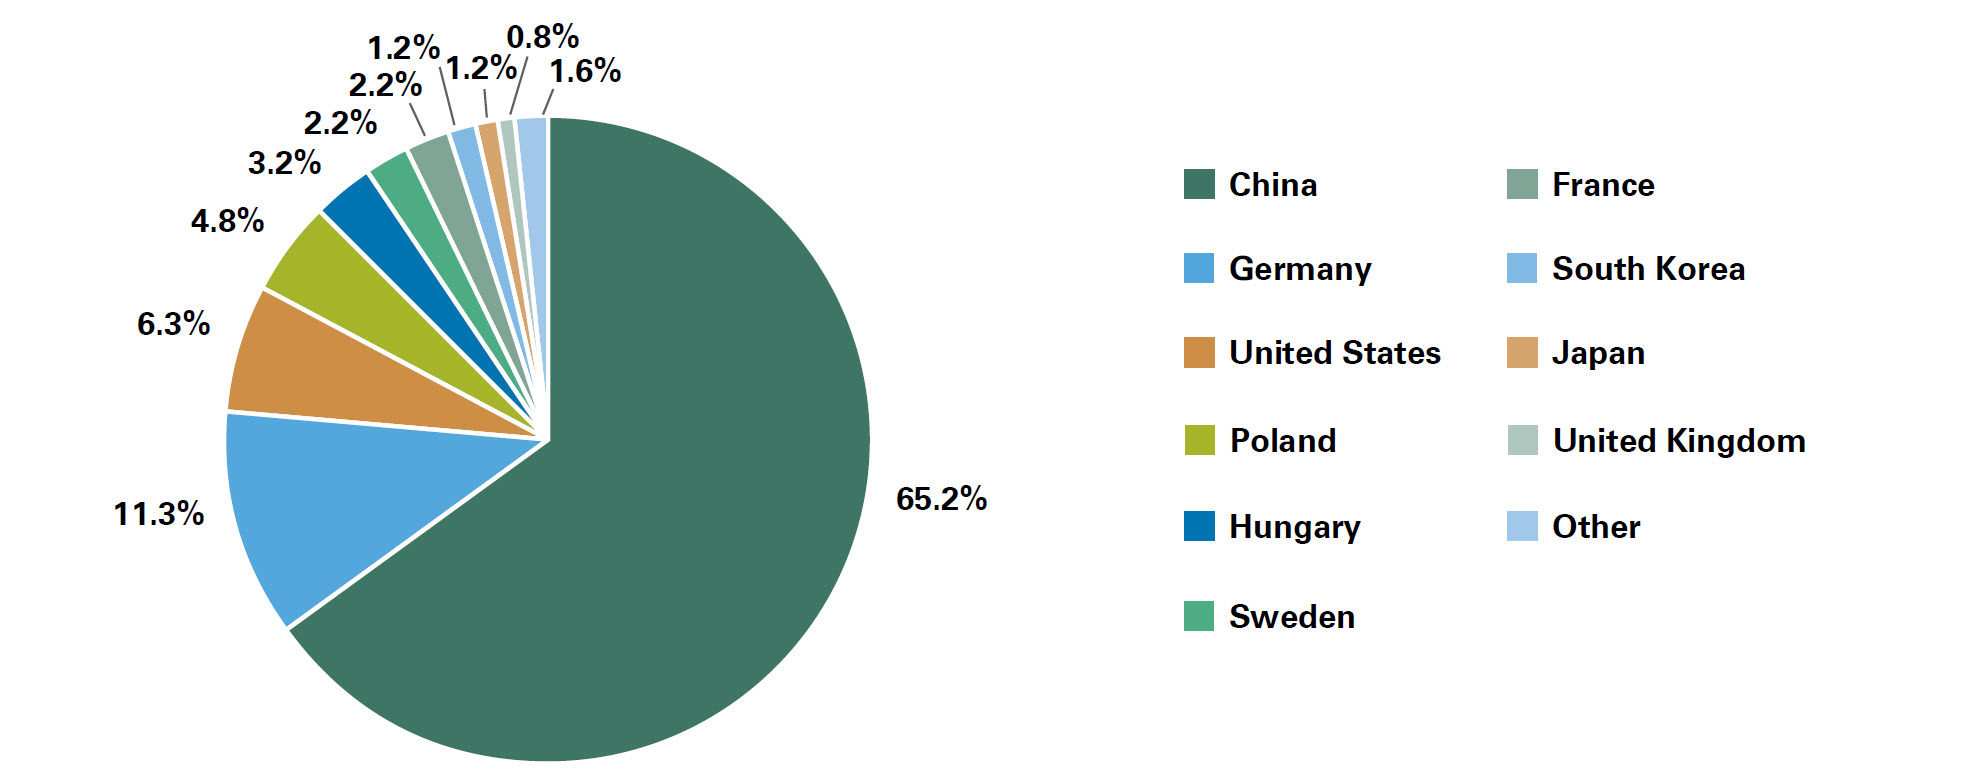
Exhibit 7: Top 10 Countries for EV Battery Manufacturing
Key Takeaway: Two-thirds of global EV battery manufacturing occurs in China. As of January 10, 2024. Source: Drive Electric
Exhibit 7 is a pie chart depicting the top 10 countries for EV battery manufacturing: China (65.2% share), Germany (11.3%), United States (6.3%), Poland (4.8%), Hungary (3.2%), Sweden (2.2%), France (2.2%), South Korea (1.2%), Japan (1.2%) United Kingdom (0.8%), Other (1.6%).
As of January 10, 2024. Source: Drive Electric
Source: Drive Electric
Although Taiwan’s Taiwan Semiconductor Manufacturing Company (TSMC) still manufactures the most advanced chips in the world, China also has significant semiconductor manufacturing capabilities (Exhibit 8). China’s Semiconductor Manufacturing International Corporation (SMIC) has been able to close the gap much faster than anticipated, with many reports of users p chips inside Chinese-made smartphones that are more advanced than Western analysts thought the country was capable of producing.
Exhibit 8: Distribution of Global Semiconductor Fabricating Capacity
Key takeaway: China has a high overall semiconductor manufacturing capacity despite not producing many cutting-edge chips.
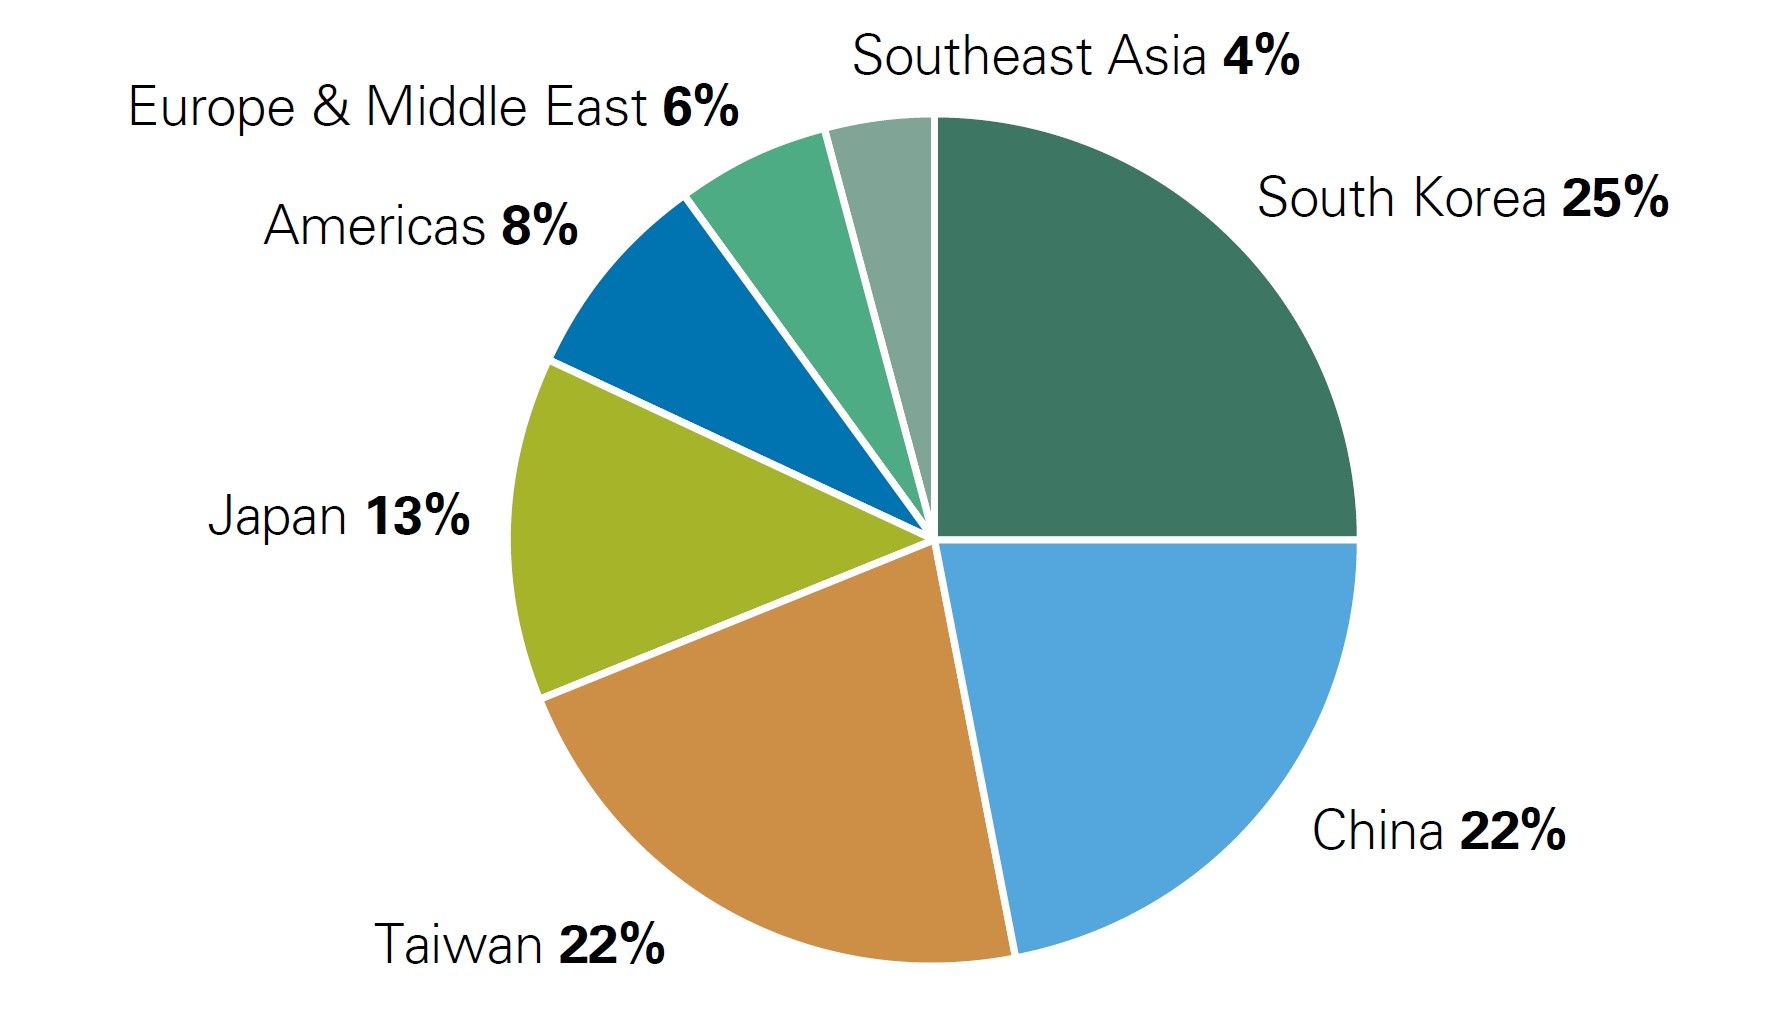
Exhibit 8: Distribution of Global Semiconductor Fabricating Capacity
Key Takeaway: China has a high overall semiconductor manufacturing capacity despite not producing many cutting-edge chips.
Exhibit 8 is a pie chart showing country shares of semiconductor manufacturing capacity – China (22%), Taiwan (22%), Japan (13%), the Americas (8%), Europe and the Middle East (6%), and Southeast Asia (4%).
As of December 31, 2022. Source: SEMI 300mm Fab Outlook to 2026
Source: SEMI 300mm Fab Outlook to 2026
China also produces more than 90% of the world’s gallium, which could be a key ingredient for the next generation of chips with much faster computational speeds.
Finally, China is the global leader in the number of AI-related patents per year. Although the most cutting-edge AI innovation still comes from U.S. corporations and universities, the Chinese government has shown a willingness to invest heavily in AI model development.
The Bessemer All Equity portfolio is underweight China versus the benchmark on both a revenue exposure and domicile basis. Within Bessemer’s equity portfolios, we focus on areas of the Chinese economy with long term structural growth. Tencent is an example of a company with many high margin and high growth business units, such as video games, advertising, and TV shows. Likewise, managers in our private equity program invest in several Chinese companies related to the growing digital economy: Meituan is an online shopping platform for consumer products and retail services, and ShadowBot develops AI-based human interaction bots for e-commerce merchants.
Why We Remain Overweight the U.S.
While we continue to find select opportunities internationally, our All Equity portfolio remains overweight the U.S. versus the benchmark both on a domicile and revenue exposure basis, where we believe high-quality companies are abundant. As currency moves have exacerbated performance divergence, the U.S. dollar’s dominance remains key. When asked if U.S. outperformance will continue, many point to U.S. exceptionalism, and there is, in fact, a mosaic of data supporting this notion.
The U.S. has many structural advantages. For example, it possesses most of the world’s top universities — 25 of the world’s top 50 global universities, and eight of the top 10 — which attract superior talent from abroad and help fuel innovation.
Notably, the scale advantage of U.S. capital markets is tough to compete with. In U.S. dollars, the market capitalization of the S&P 500 is $49 trillion, compared to $4.8 trillion for the Euro Stoxx 50, $2.6 trillion for Hang Seng, and $4.7 trillion for the Nikkei.
The U.S. has been more resilient to the shocks of rising inflation and, in turn, elevated interest rates than many global peers. This resilience has in part been driven by growing innovation — the innovation gap has widened between the U.S. and the rest of the world (Exhibit 9). The U.S. has the highest number of start-ups, strong investment in R&D, and robust intellectual property laws. Additionally, not only is innovation plentiful, but sector allocations for the equity market are also more exposed to innovation. In turn, this has led to a higher return on equity in the U.S. relative to other markets.
Exhibit 9: Number of World-Class Patents in Advanced Digital Technologies
Key takeaway: The innovation dispersion has widened between the U.S. and its peers.
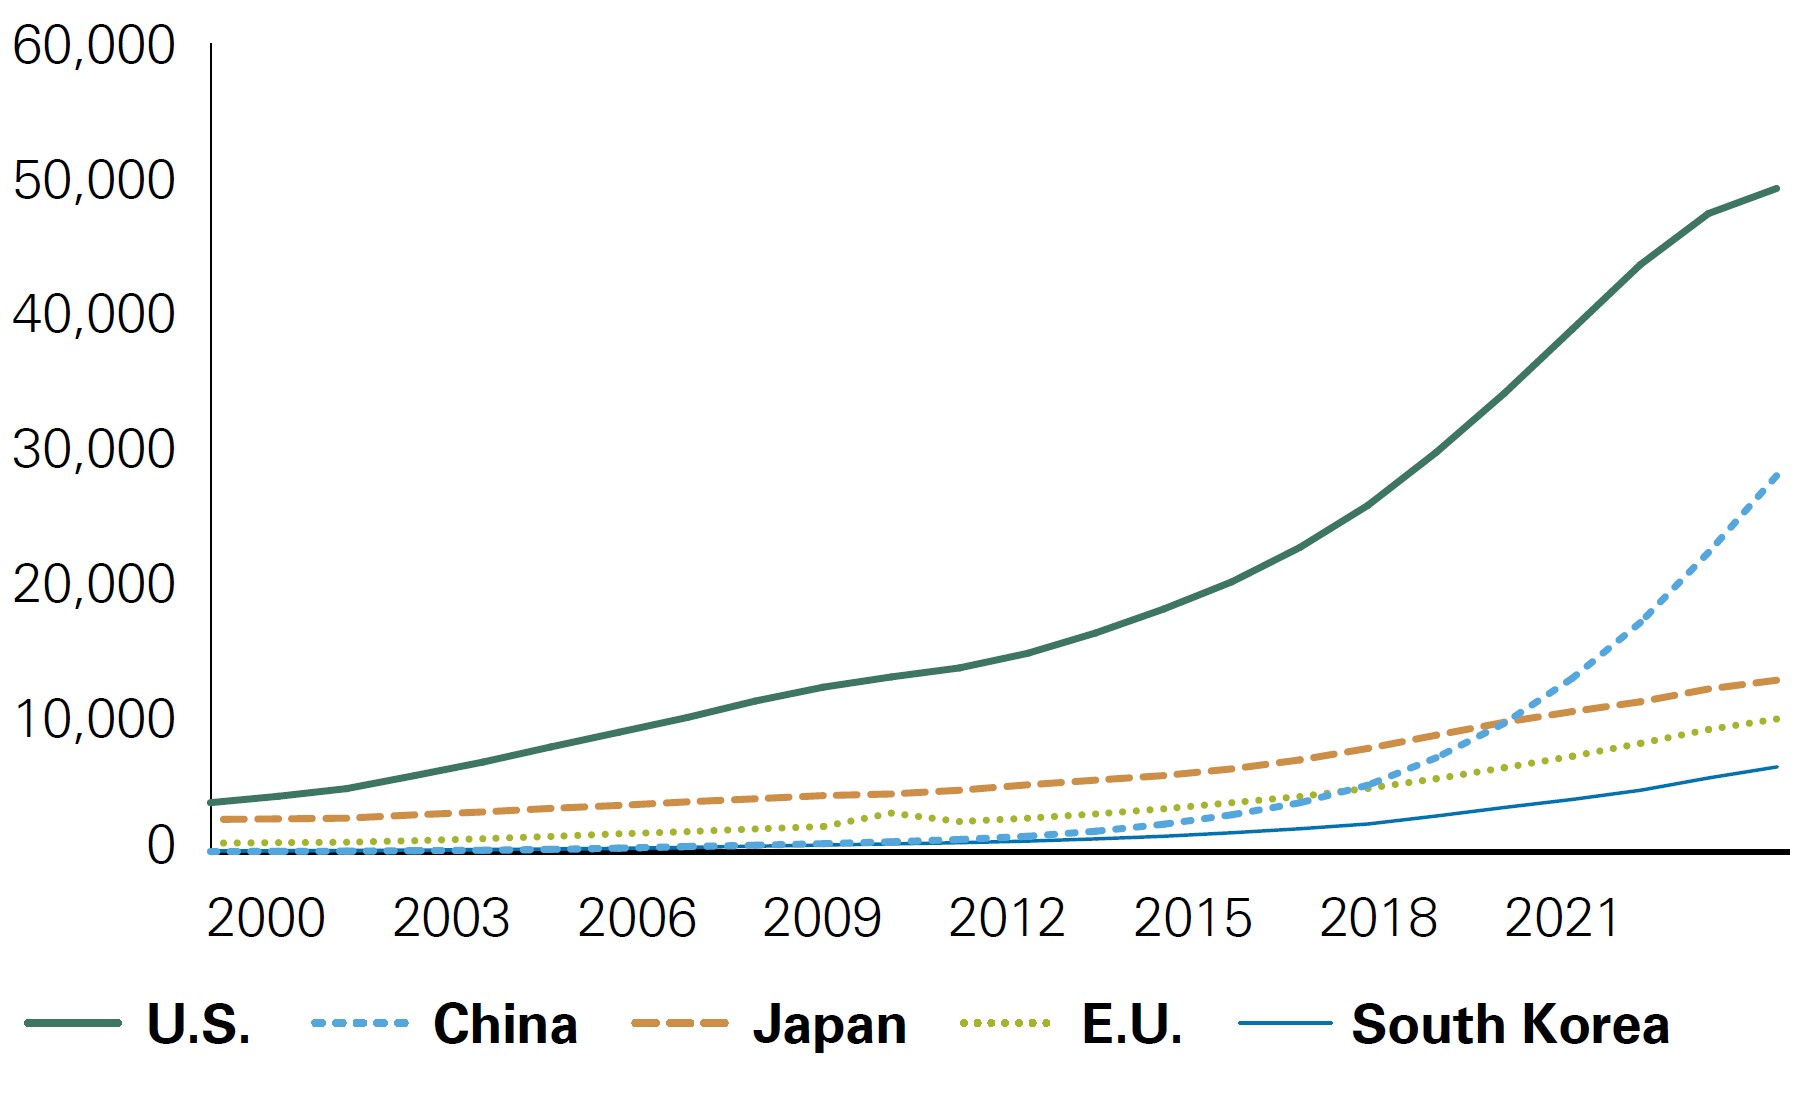
Exhibit 9: Number of World-Class Patents in Advanced Digital Technologies
Key Takeaway: The innovation dispersion has widened between the U.S. and its peers.
Exhibit 9 is a line graph that compares the annual number of patents in advanced digital technologies in the U.S., China, Japan, the EU, and South Korea. Since 2000, the U.S. has increased its lead over the other countries, with significant gains in the past 10 years.
As of: December 31, 2023. Source: Association of the Bavarian Economy, Financial Times
Source: Association of the Bavarian Economy, Financial Times
Conclusion
In the coming months, diverging macroeconomic environments can create additional opportunities outside of the U.S. While we remain confident in our overweight to the U.S., we are excited by select opportunities outside of the U.S., particularly those related to durable secular themes such as artificial intelligence, healthcare innovation, and infrastructure spending. Even when the overall outlook for a particular country may not be spectacular, there can still be national stalwarts with strong long term growth characteristics.
Bessemer’s portfolio managers are experienced in analyzing the fundamentals of individual companies in foreign countries and remain focused on high-quality businesses. In recent years, the U.S. dollar has been strong relative to long term levels, but exchange rates could begin to normalize as the Federal Reserve begins its interest rate cutting cycle later this year. Historically, non-U.S. stocks have performed better in environments with a depreciating dollar — a dynamic that can be additive to already-compelling high-quality non-U.S. investments.
Past performance is no guarantee of future results. This material is provided for your general information. It does not take into account the particular investment objectives, financial situations, or needs of individual clients. This material has been prepared based on information that Bessemer Trust believes to be reliable, but Bessemer makes no representation or warranty with respect to the accuracy or completeness of such information. This presentation does not include a complete description of any portfolio mentioned herein and is not an offer to sell any securities. Investors should carefully consider the investment objectives, risks, charges, and expenses of each fund or portfolio before investing. Views expressed herein are current only as of the date indicated, and are subject to change without notice. Forecasts may not be realized due to a variety of factors, including changes in economic growth, corporate profitability, geopolitical conditions, and inflation. The mention of a particular security is not intended to represent a stock-specific or other investment recommendation, and our view of these holdings may change at any time based on stock price movements, new research conclusions, or changes in risk preference. Index information is included herein to show the general trend in the securities markets during the periods indicated and is not intended to imply that any referenced portfolio is similar to the indexes in either composition or volatility. Index returns are not an exact representation of any particular investment, as you cannot invest directly in an index.