Labor Market Update in Five Pictures
The strength of the labor market has perplexed investors, economists, and the Fed over the past year as unemployment remained at record lows and job openings at record highs despite an aggressive Fed tightening cycle. Though the labor market remains tight, employment data has begun to soften at the margins as pandemic distortions fade and labor demand and supply return to more normalized levels. The rebalancing of the labor market should help ease wage pressures and, in turn, temper core services inflation. In a recent speech, Fed Chair Powell highlighted that “core services other than housing may be the most important category for understanding the future evolution of core inflation.” Because wages make up the largest cost in core services excluding housing, the labor market holds the key to understanding inflation in this category and will drive the Fed outlook as well.
In this regard, we are providing a brief update on what we are seeing in the latest employment data. While current labor market data is strong and wage pressures are elevated, evidence is emerging that these pressures are easing, and further moderation lies ahead. Headlines in financial media on this topic are mixed in that some overstate labor market strength and some understate it. Our goal in this Investment Insights is to provide clarity on the dynamics in the space by highlighting key findings pertaining to the labor market in the five pictures that follow.
Layoffs and Pandemic Hiring
Key Takeaway: Despite layoff announcements recently highlighted in news headlines, the number of workers receiving pink slips is dwarfed by the number of employees hired over the past few years. Some companies that saw pandemic-fueled growth are now preparing for a slower growth environment.
Exhibit 1: Layoffs and Pandemic Hiring
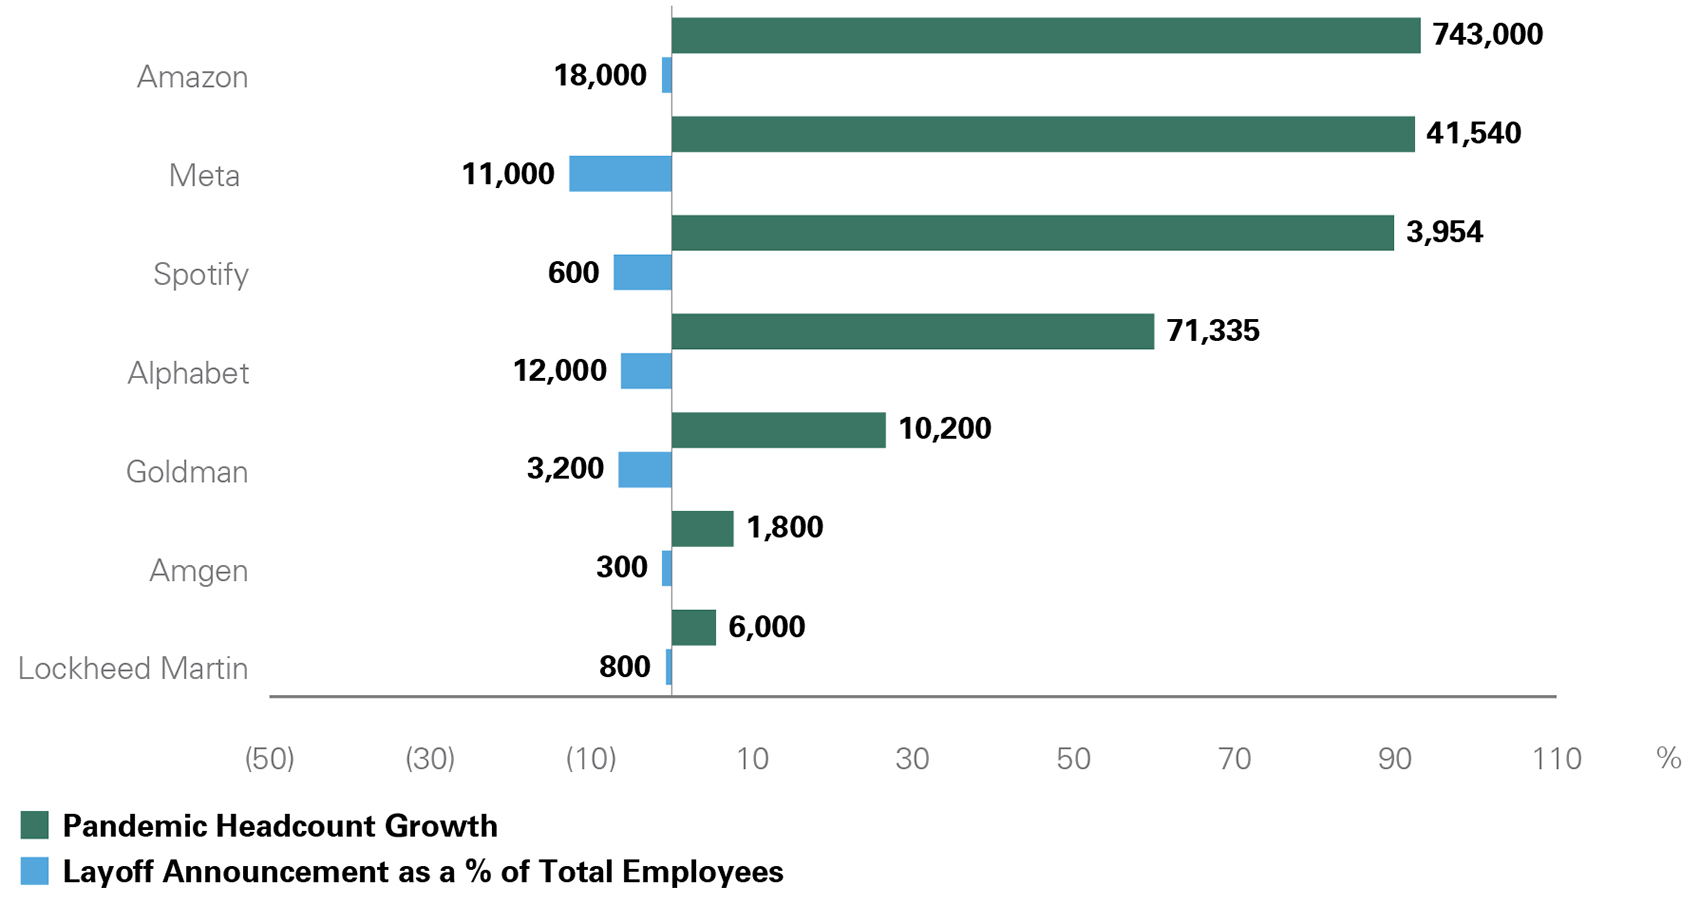
A bar chart showing pandemic headcount growth versus layoffs for selected major companies, illustrating that hiring gains during the pandemic far exceed recent layoff announcements.
Source: Bloomberg
Initial Jobless Claims and Unemployment Rate
Key Takeaway: Although layoff announcements are rising, initial jobless claims and unemployment remain low.
Exhibit 2: Initial Jobless Claims and Unemployment Rate
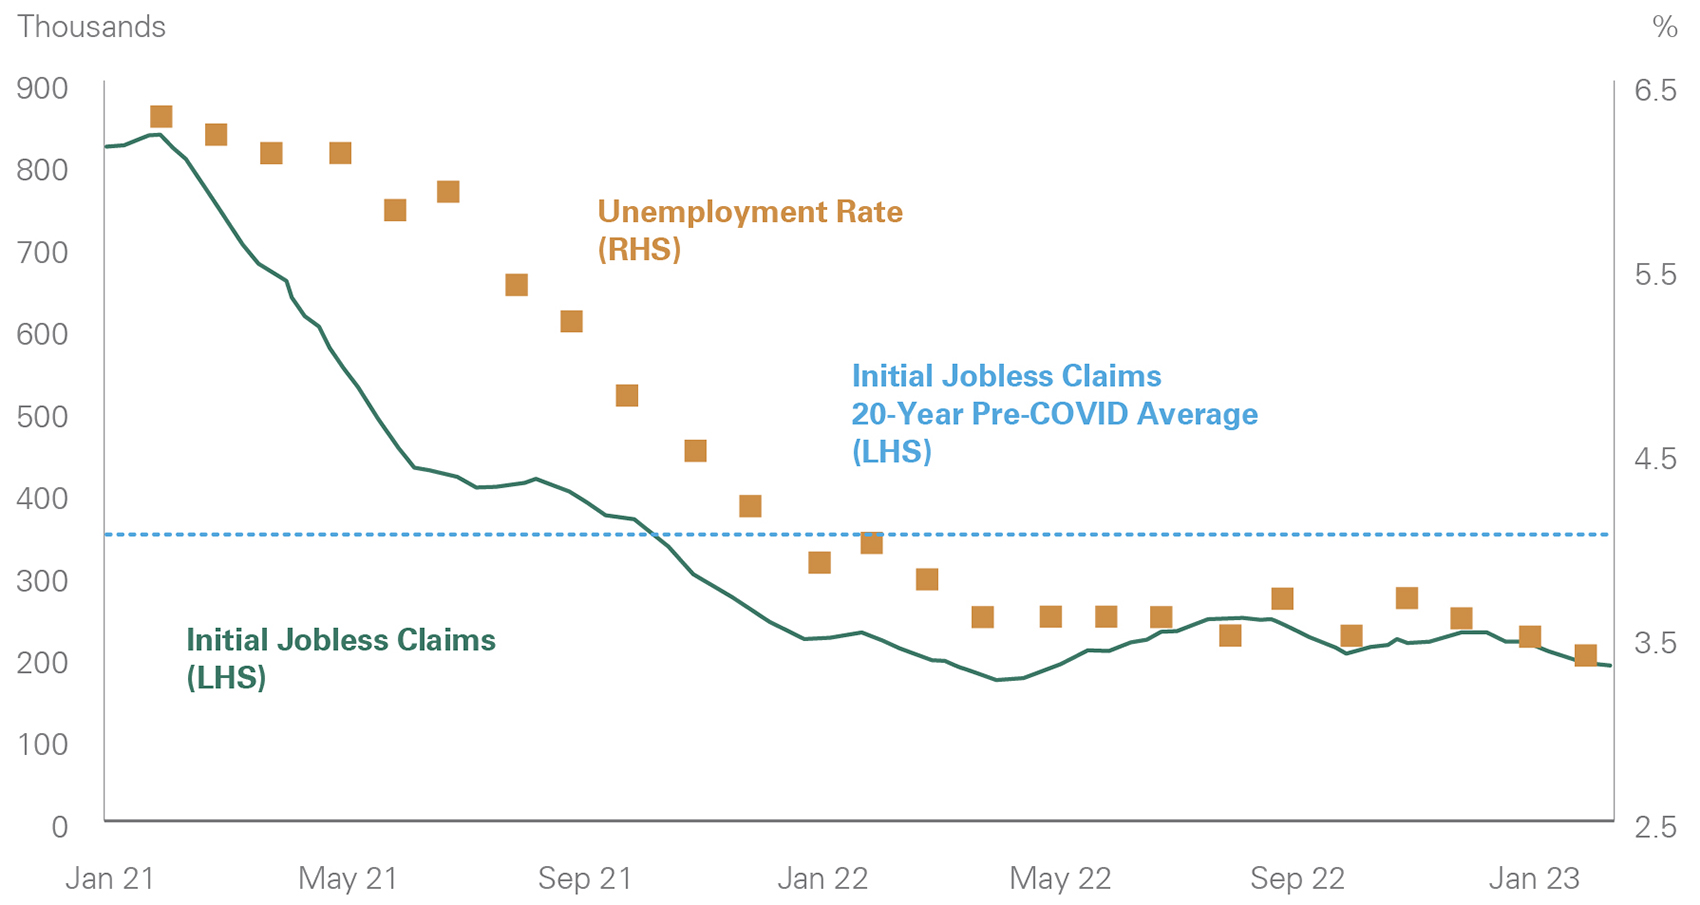
A dual-axis line chart plotting initial jobless claims alongside the U.S. unemployment rate over time, demonstrating trends in labor market stability despite rising layoffs.
Source: Bloomberg
U.S. Participation Rate and Missing Workers by Post-COVID Cohort
Key Takeaway: While labor force participation has improved recently, it remains below pre-pandemic levels as early retirees, aging demographics, and health and childcare challenges affect labor supply availability.
Exhibit 3: U.S. Participation Rate and Missing Workers by Post-COVID Cohort
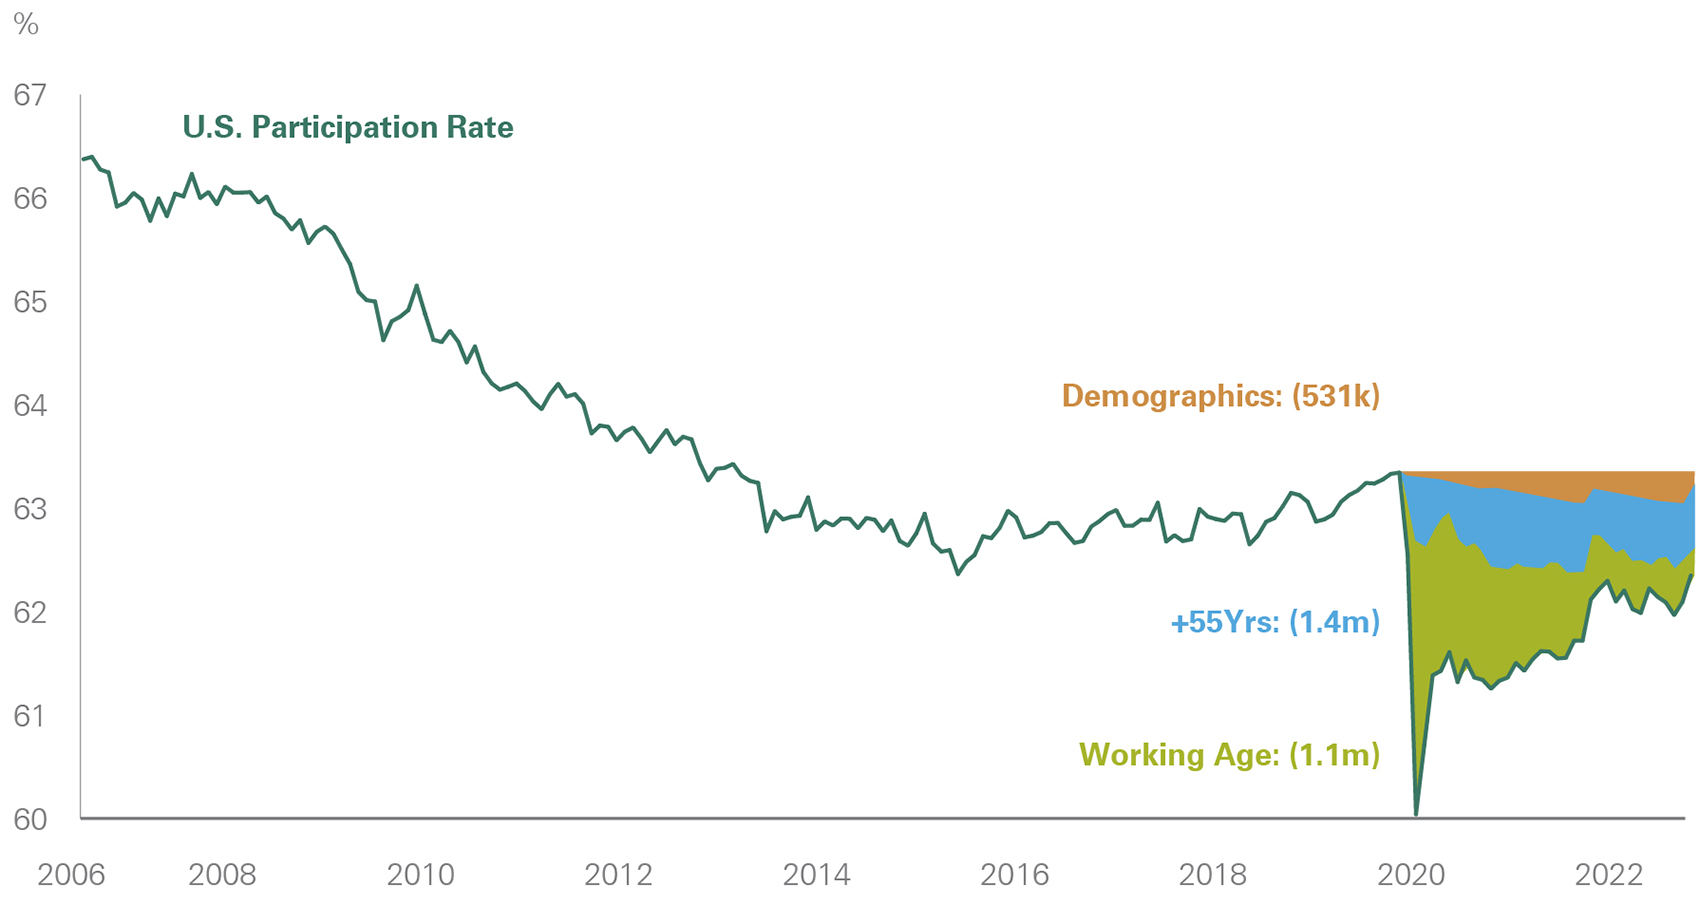
A combined line and bar chart depicting the U.S. labor force participation rate over time with accompanying bars showing the number of missing workers by age cohort, highlighting ongoing participation gaps relative to pre-pandemic levels.
Source: Bureau of Labor Statistics
Number of Job Openings per Unemployed Person and Quits Rate
Key Takeaway: The labor market remains historically tight with nearly two job openings per each unemployed person and the quits rate elevated, though it has loosened at the margin from peak levels seen early last year. An increasingly challenging economic environment has likely caused some companies to reduce job openings.
Exhibit 4: Number of Job Openings per Unemployed Person and Quits Rate
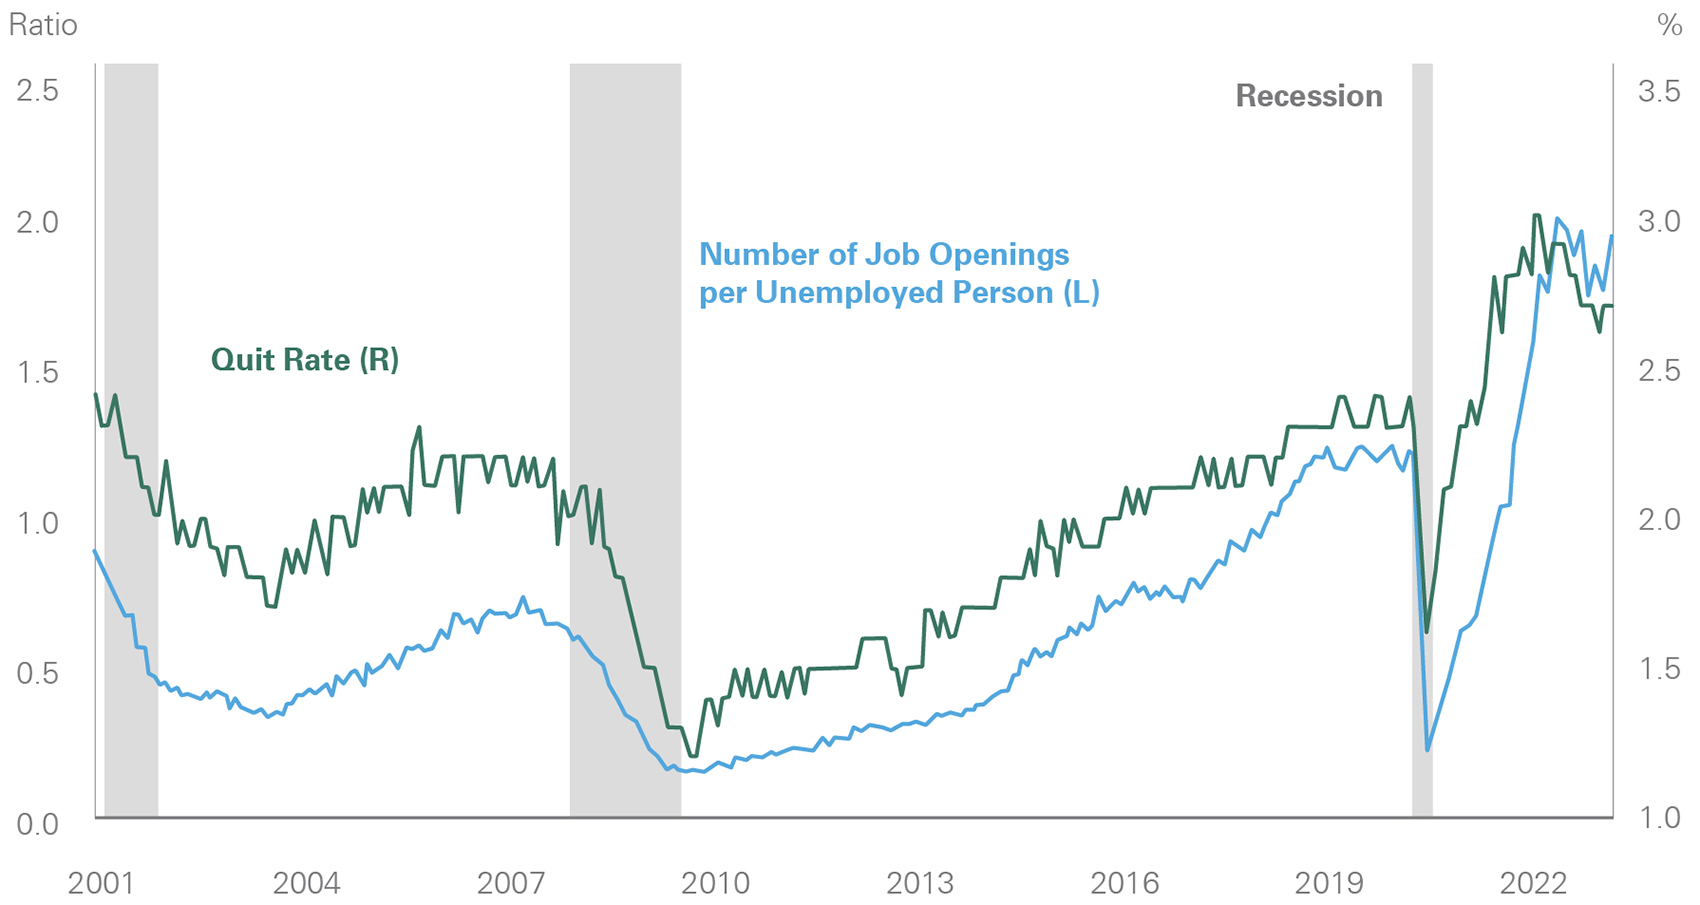
A chart contrasting the number of job openings per unemployed person with the quits rate, underscoring that the labor market remains historically tight but has eased somewhat from prior peaks.
Source: Bloomberg
Atlanta Fed Wage Growth Tracker
Key Takeaway: Wage growth remains elevated but has declined given labor market loosening and less pressure on cost-of-living adjustments as inflation moderates.
Exhibit 5: Atlanta Fed Wage Growth Tracker
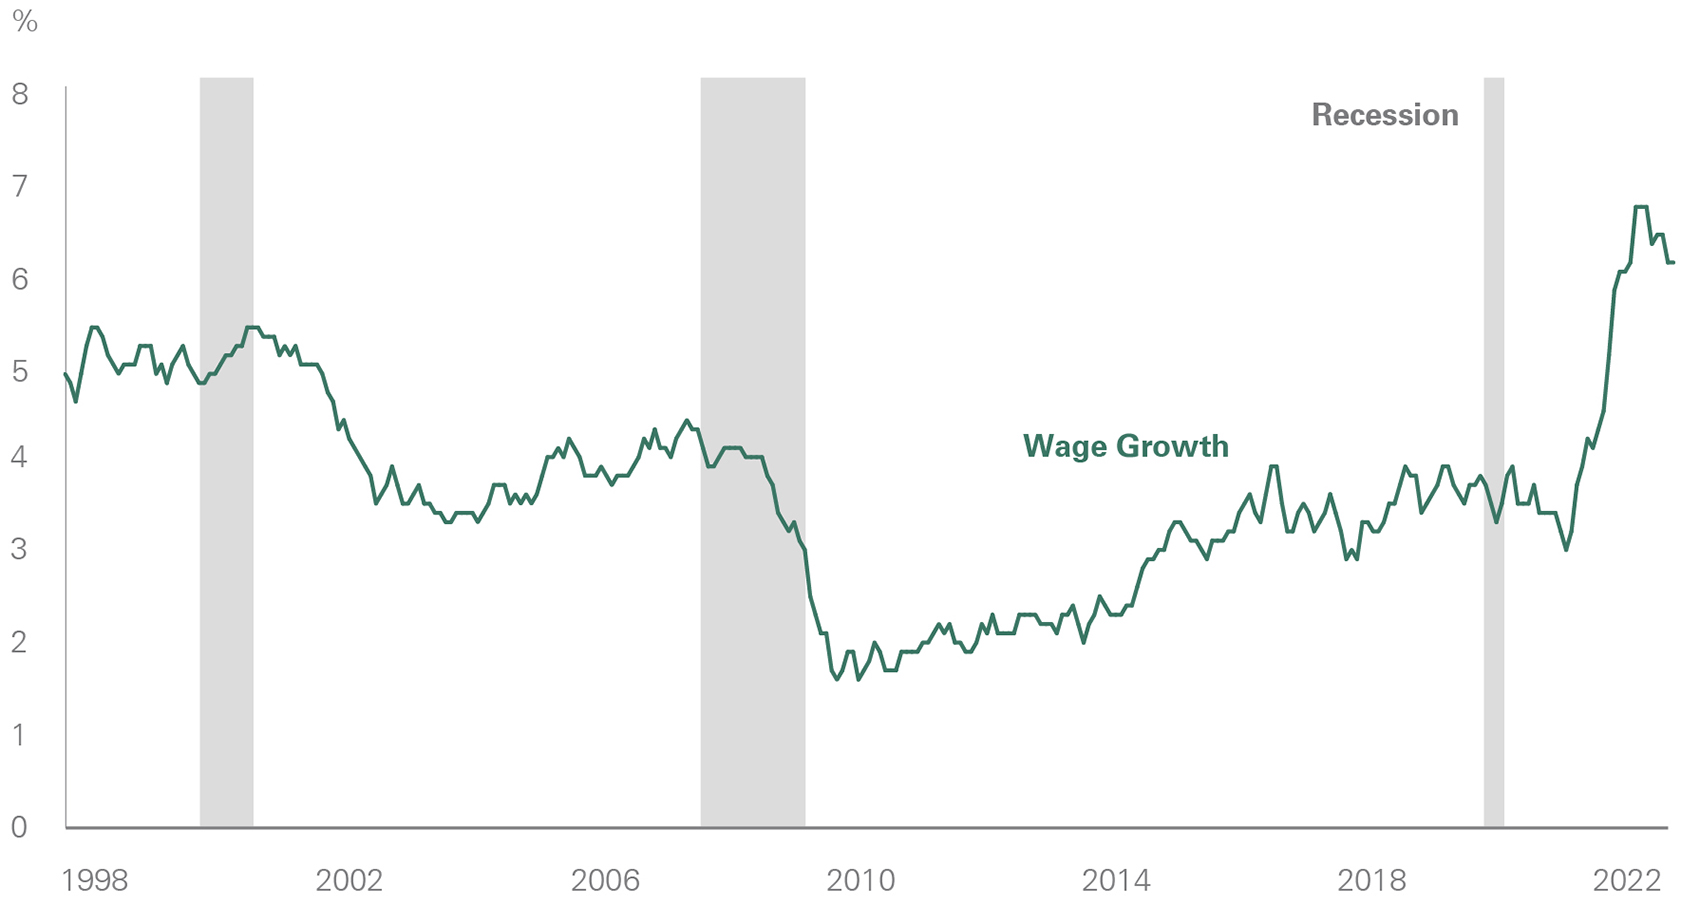
A line chart illustrating the Atlanta Fed Wage Growth Tracker, which shows the median percent change in hourly wage growth over the past year, highlighting elevated but moderating wage pressures.
Source: Federal Reserve Bank of Atlanta
Past performance is no guarantee of future results. This material is provided for your general information. It does not take into account the particular investment objectives, financial situations, or needs of individual clients. This material has been prepared based on information that Bessemer Trust believes to be reliable, but Bessemer makes no representation or warranty with respect to the accuracy or completeness of such information. This presentation does not include a complete description of any portfolio mentioned herein and is not an offer to sell any securities. Investors should carefully consider the investment objectives, risks, charges, and expenses of each fund or portfolio before investing. Views expressed herein are current only as of the date indicated, and are subject to change without notice. Forecasts may not be realized due to a variety of factors, including changes in economic growth, corporate profitability, geopolitical conditions, and inflation. The mention of a particular security is not intended to represent a stock-specific or other investment recommendation, and our view of these holdings may change at any time based on stock price movements, new research conclusions, or changes in risk preference. Index information is included herein to show the general trend in the securities markets during the periods indicated and is not intended to imply that any referenced portfolio is similar to the indexes in either composition or volatility. Index returns are not an exact representation of any particular investment, as you cannot invest directly in an index.