Consumer Resilience Persists, Though Nuances Have Emerged
- Consumer strength has been a prominent macroeconomic theme as strong savings have insulated the consumer from a challenging economic environment.
- Although headwinds are building, the labor market remains supportive of consumer resilience.
- The switch from goods to services spending has become more pronounced as the economic environment has forced consumer tradeoffs; we believe that Bessemer portfolios are well positioned to capture the shift in spending from goods to services.
The strength of the consumer is a key macroeconomic indicator given that goods and services consumption is a main driver of U.S. economic growth. Despite pressures resulting from high inflation and elevated interest rates in the past year, the U.S. consumer has remained remarkably resilient. That strength was a prominent source of growth last year and supported our view that a recession was not yet imminent. While the consumer has remained strong thus far in 2023, the backdrop has become more nuanced given growing headwinds.
Emerging from the COVID-19 lockdowns, various tailwinds supported overall consumer health. Excess consumer savings, defined as the difference between current savings and average pre-COVID savings, grew during the pandemic primarily due to government stimulus payments, a tight labor market increasing nominal wages, and constraints on leisure activities and travel. Consumer balance sheets emerged from the pandemic in excellent shape as individuals used this time to pay down and refinance existing debt to capitalize on low interest rates. On the back of these tailwinds, consumption has been supportive of overall growth. Looking ahead, we expect the average consumer’s finances to remain healthy, but we are likely to see a moderation in spending.
While consumer strength has not yet been exhausted, it has weakened relative to last year, in part as the large pull forward in spending appears to fade as excess savings diminish. However, we expect still-strong consumer balance sheets to help insulate the consumer from emerging economic challenges. Tightening credit conditions are likely to be a headwind, though the degree to which they may weigh on consumer spending is uncertain. Although inflation has been on a steady decline since the summer of 2022, surveys reveal that it remains the top concern for consumers, particularly for the middle- and lower-income cohorts. Consumers are beginning to pull back spending on discretionary items, though data indicates that consumer spending on travel remains robust.
A complex macroeconomic environment has spurred important shifts in consumer behaviors. Periods of financial stress can push consumers to consider tradeoffs such as going to a discount store instead of a traditional retailer, reducing their standard basket size of goods at the store, or cooking at home instead of dining at a restaurant. Moreover, consumers have transitioned their spending from goods to services and intend to further shift their wallet share away from discretionary goods and services toward nondiscretionary categories such as food and rent — two trends that have important investment implications.
A Closer Look at Consumer Balance Sheets
Savings. Excess savings have been a driver of consumer spending following COVID lockdowns. It is estimated that around $1 trillion of excess savings remain relative to the peak of $2.5 trillion last August. The negative impacts of rising interest rates and elevated inflation were in part mitigated by strong excess savings. However, cash buffers are declining at a faster rate for lower-income quintiles while higher-income quintiles still have ample excess savings. The first quarter earnings call for JPMorgan noted that cash buffers are slowly normalizing and cash buffers for lower-income segments are expected to revert to pre-pandemic levels in the second half of this year. Although excess savings for the lower-income consumer may be exhausted by the end of this year, it is important to note that 80% of consumption comes from the top three income quintiles. Additionally, the savings rate has started to tick up in the last few months amid a pullback in consumer spending as consumers are likely becoming more cautious in this uncertain economic environment (Exhibit 1). However, even with a slower growth backdrop, we expect elevated excess savings and a strong labor market to support consumption in the near term.
Exhibit 1: Excess Savings and Savings Rate
Key takeaway: Although consumers have spent down excess savings from the pandemic, around $1 trillion of excess saving remains.
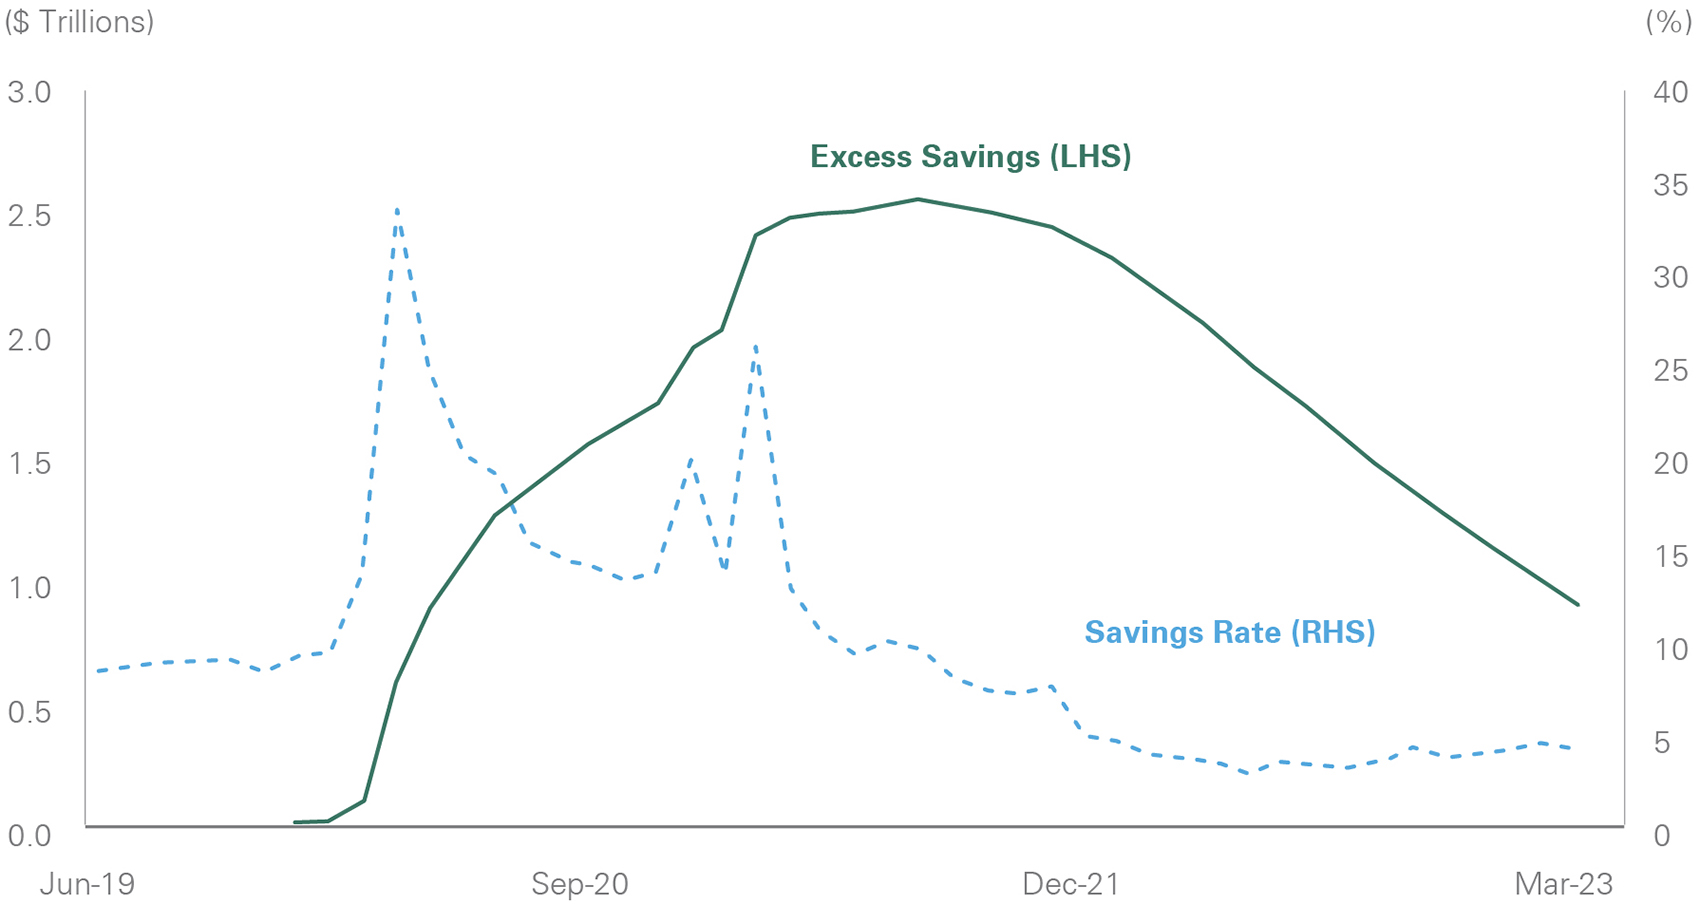
A line graph depicting two series: total consumer savings in dollar amounts and excess consumer savings as a percentage of total savings. Both measures rose sharply during the pandemic and then declined over the year. In the most recent data (as of April 28, 2023), total savings have leveled off and excess savings have fallen from above 30% to the mid-teens. The chart illustrates that although consumers have spent down a significant portion of pandemic savings, roughly $1 trillion of excess savings remains. Data source: Federal Reserve Economic Database.
Source: Federal Reserve Economic Database
Credit conditions. Consumer balance sheets remain healthy despite developing economic headwinds. Although credit usage has increased in the past year, overall debt servicing costs, which encompass mortgage and consumer payments, remain low as a percentage of disposable income. Consumers are more insulated from rising rates relative to prior hiking cycles as 90% of household debt is locked in at a fixed rate compared to 74% in 2005, a factor that has mitigated debt service ratio increases.
Loan delinquency rates also remain low relative to history as individuals have largely been able to absorb higher debt costs. However, pockets of stress are starting to appear in the credit card and auto loan markets, especially among young and subprime borrowers. While mortgage delinquencies have been slower to rise, credit card and auto loan delinquencies are approaching pre-pandemic levels (Exhibit 2). Delinquency rates for borrowers under the age of 40, who are more exposed to variable rate loans, have risen to pre-pandemic levels but remain below prior periods of economic stress. Similarly, modest increases in delinquency rates have been seen in the subprime auto loan market, an area of credit that is more exposed to the lower-end consumer as a result of lower auto loan lending standards relative to other segments, such as mortgages. Despite pockets of weakness, credit conditions remain healthy and are not yet at a level that would be a cause for concern.
Exhibit 2: Transition into Delinquency (30+ Day) by Loan Type
Key takeaway: Although delinquencies are on the rise, consumers have been able to better cope with higher interest rates relative to past hiking cycles.
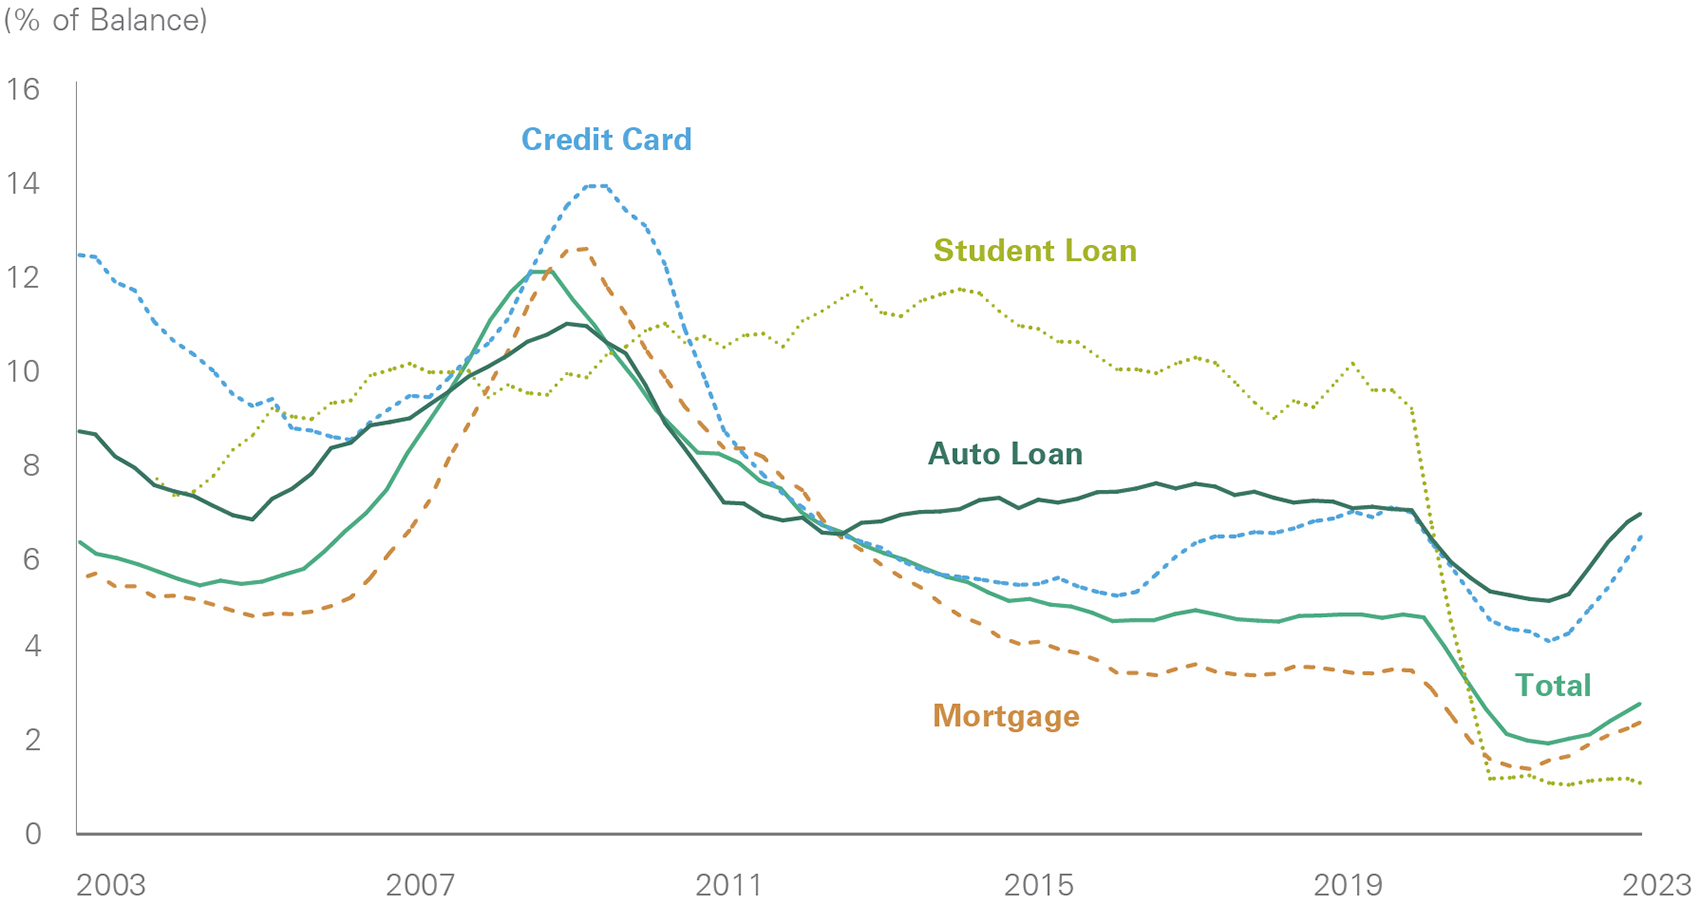
A line graph comparing the transition into 30-day or more delinquency for multiple loan categories: credit cards, student loans, auto loans, and mortgages, along with an overall total line. All categories show a drop heading into the pandemic, an increase afterward, and current levels that remain below the highest points of the past decade. This visualization highlights that while delinquencies have risen with tightening credit conditions and higher rates, the overall delinquency picture is still relatively contained.
Source: Federal Reserve Bank of New York Consumer Credit Panel/Equifax
Spending. A challenging macroeconomic environment is driving the consumer to become more cautious, price sensitive, and selective on purchases. Such shifting trends are reflected in credit card data, which has shown a softening in spending momentum from the robust levels of 2022 and early 2023. The handoff from goods to services has become more pronounced. Consumer sentiment surveys have shown a weakening in buying conditions for large household durables, vehicles, and houses. While a pullback in spending on big-ticket items is often seen as a negative economic indicator of consumer confidence, this segment was largely affected by a pull-forward effect during the pandemic.
Although disruptions in the banking sector have tightened credit conditions, the extent to which this will slow overall consumer spending remains to be seen. Still, we expect it to have a greater impact on goods spending relative to services. The tightening of credit will likely have a greater impact on durable goods expenditures as big-ticket items such as autos are typically purchased with credit, making them the most rate-sensitive component of consumer spending (Exhibit 3).
Exhibit 3: Bank Willingness to Lend and Durable Goods Consumption
Key takeaway: Goods purchases are more sensitive to credit availability; therefore, tightening credit conditions will likely lead to a further pullback on goods spending.
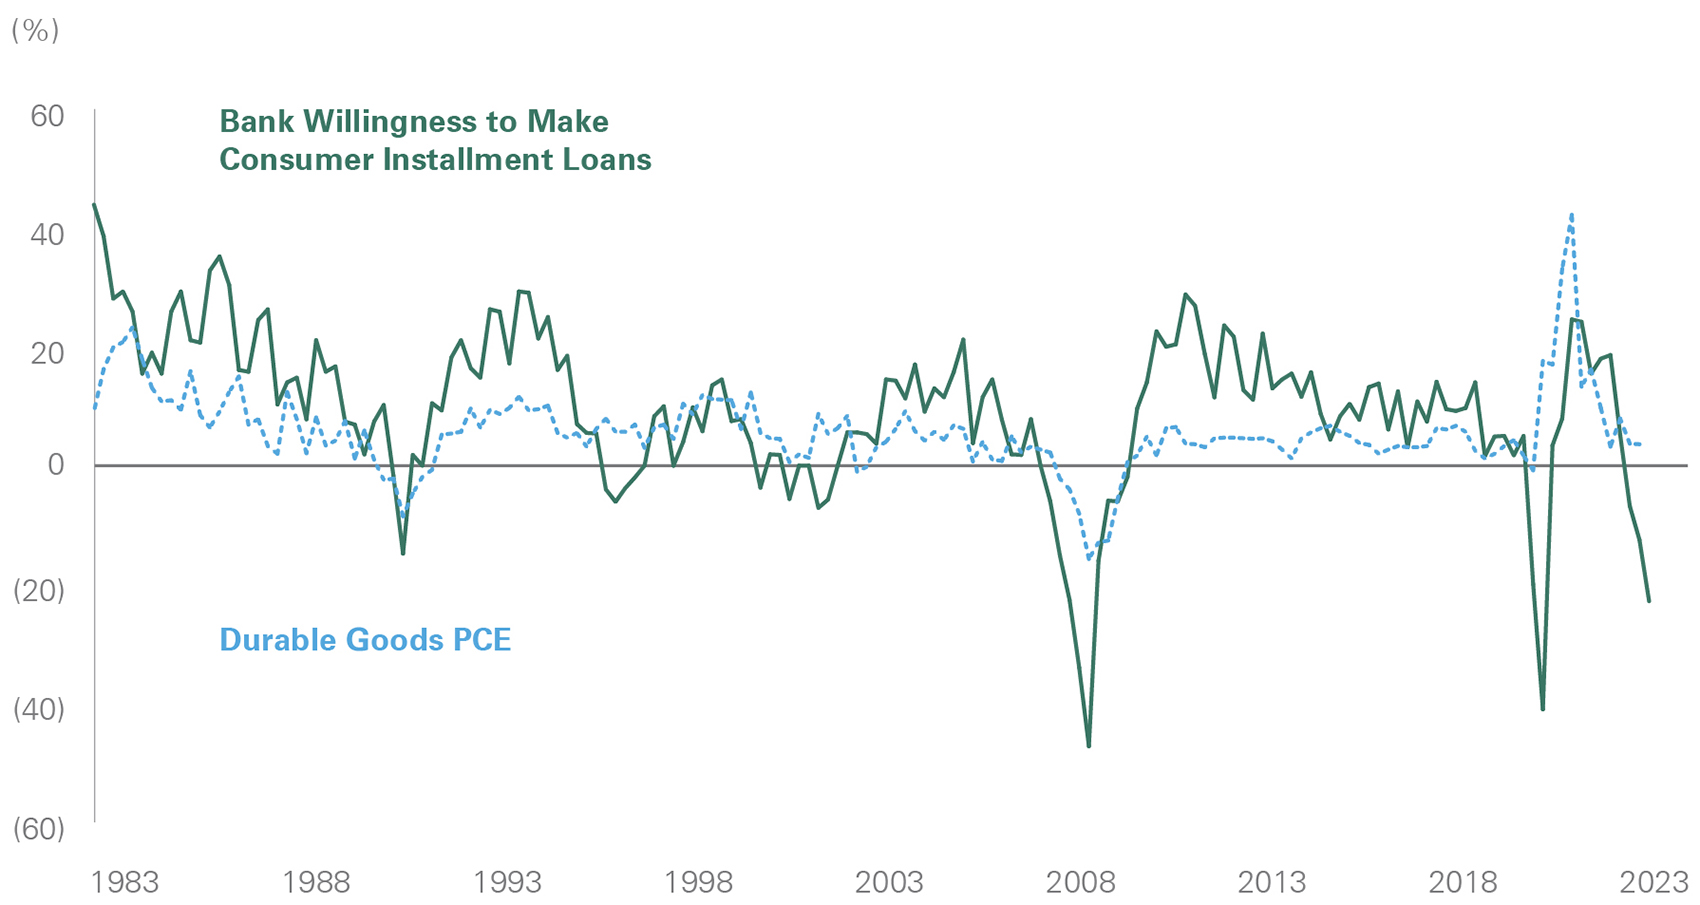
A dual-line graph tracking two variables over time: personal consumption expenditures on durable goods and bank willingness to make consumer installment loans. Both series exhibit similar patterns, with durable goods spending decreasing as banks tighten credit availability. The chart illustrates how tightening lending conditions are associated with a pullback in durable goods consumption, reflecting consumer sensitivity to credit conditions.
Source: Federal Reserve Economic Database
Service spending, which is highly correlated to the labor market, remains robust. The April Conference Board Consumer Confidence survey emphasized robust travel demand with consumer intentions to take an international vacation at the highest level since 1960. The desire to spend from the higher-end consumer remains strong, a positive indicator as the highest level income group drives a large portion of service spending. High frequency data supports this notion, showing both resiliency in airline travel and continuing weakness in retail sales (Exhibit 4). We expect this bifurcation in spending to continue.
Exhibit 4: U.S. TSA Daily Throughput and U.S. General Merchandise Retailers Same Store Sales
Key takeaway: While retail spending continues to show weakness, airline spending has remained resilient.
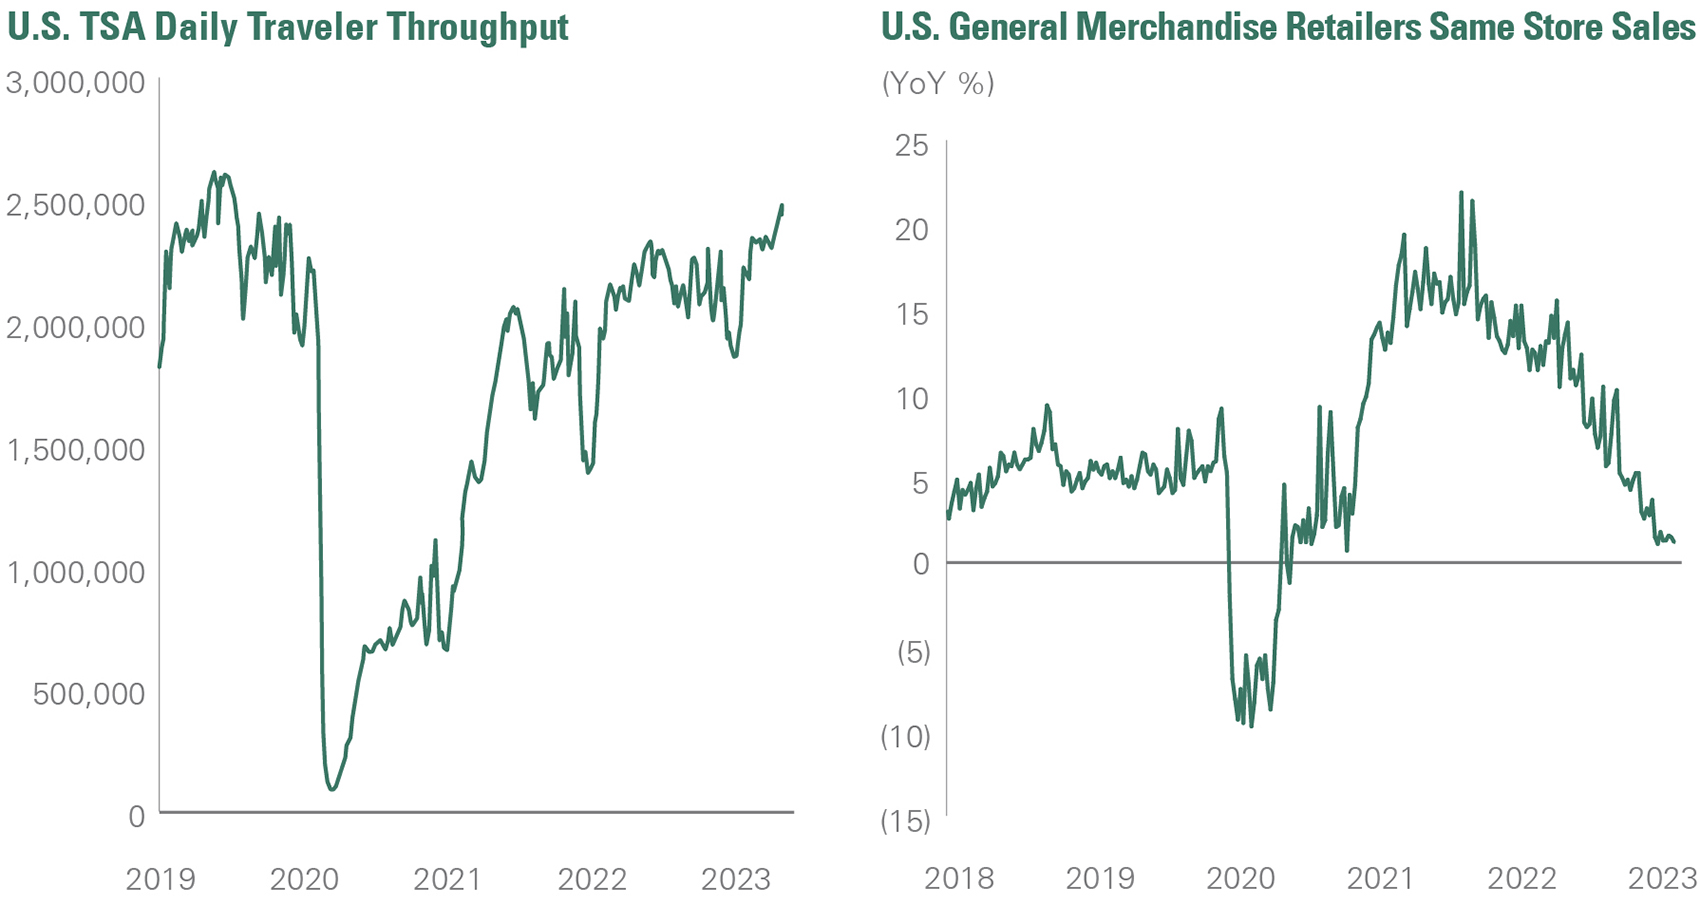
A paired set of line graphs illustrating U.S. TSA daily passenger throughput (7-day average) and U.S. general merchandise retailers’ same-store sales index. The TSA throughput shows a dramatic drop during the pandemic followed by steady recovery, whereas retail sales surged then steadily declined in the past year. This exhibit highlights the contrast between strong travel demand and weakening retail sales performance, signaling a shift in consumer spending patterns.
Source: Bloomberg
Labor market and income. While the outlook for consumer spending is dependent on a variety of factors, the most important is the labor market. Currently, the combination of a tight labor market and a historically low unemployment rate is supporting the spending power and financial stability of the consumer. Because labor demand outstripped supply, thereby pressuirng wage inflation, the imbalance in the labor market was a contributing factor in the Fed’s decision to embark on one of the fastest tightening cycles in recent history. As the increase in interest rates permeates the economy, we are starting to see cracks emerge in the labor market, particularly in the higher-earning income segments, but overall conditions have yet to materially decline.
With service spending tied to the labor market, we believe that we will continue to see resiliency in services until there is a meaningful loosening within the labor market. With consumer spending accounting for about 68% of GDP and services consumption comprising two thirds of this, the impact of strengthened services spending outweighs that of slowing goods consumption.
An underappreciated tailwind is emerging for consumers as well: Inflation is starting to fall faster than wages, leading to real wage growth. Real wage growth has been negative for the last two years, but in the last few months, real wages have started to edge closer to positive territory (Exhibit 5). Real wage growth can help offset the anticipated negative fiscal impact of additional SNAP (Supplemental Nutrition Assistance Program) benefits rolling off and the restart of student loan payments that particularly impact lower-income consumers. Real disposable income has also been increasing, rising nine out of the last 10 months. Consumers are likely to get some of their spending power back as inflation continues its downward trajectory.
Exhibit 5: Median Usual Weekly Real Earnings
Key takeaway: With inflation falling faster than wages, real wages are moving closer to positive territory.
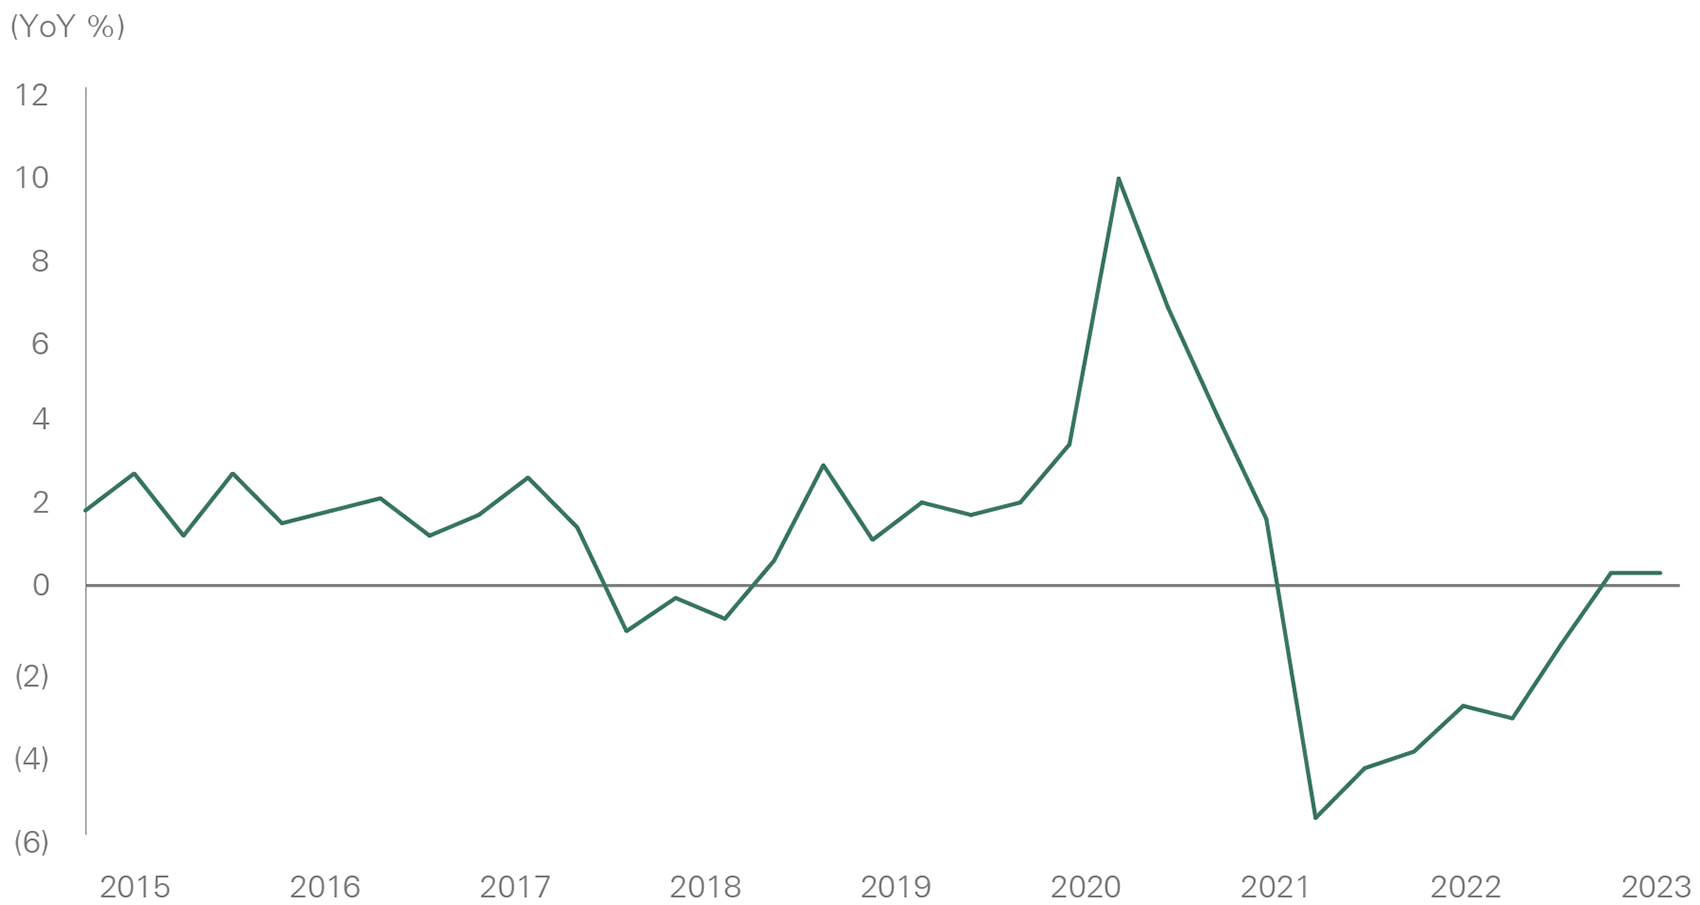
A line chart depicting year-over-year changes in median usual weekly real earnings for wage and salary workers. The chart shows a sharp increase during the pandemic, followed by a significant decline that pushed real earnings into negative territory. In the most recent data, real earnings have begun to recover toward positive growth as inflation falls faster than wages. This highlights the interplay between wage dynamics and inflation pressures on consumer purchasing power.
Source: U.S. Bureau of Labor Statistics
Investment Opportunities in Public and Private Markets
Unique consumer dynamics present exciting investment opportunities within public and private markets. Within the S&P 500 Index, the combined market capitalization of the consumer sectors is second only to the technology sector (Exhibit 6). Bessemer equity portfolios are positioned to benefit from consumer-related investment themes, including trading down from higher-priced goods to lower-priced goods, continuing services recovery, high-end consumer resilience, and a pullback in large discretionary purchases. Still, we continue to monitor for potential headwinds, particularly given the recent softening in spending.
Exhibit 6: S&P 500 Sectors by Market Cap
Key takeaway: The combined market capitalization of the consumer sectors is right below the weighting of technology.
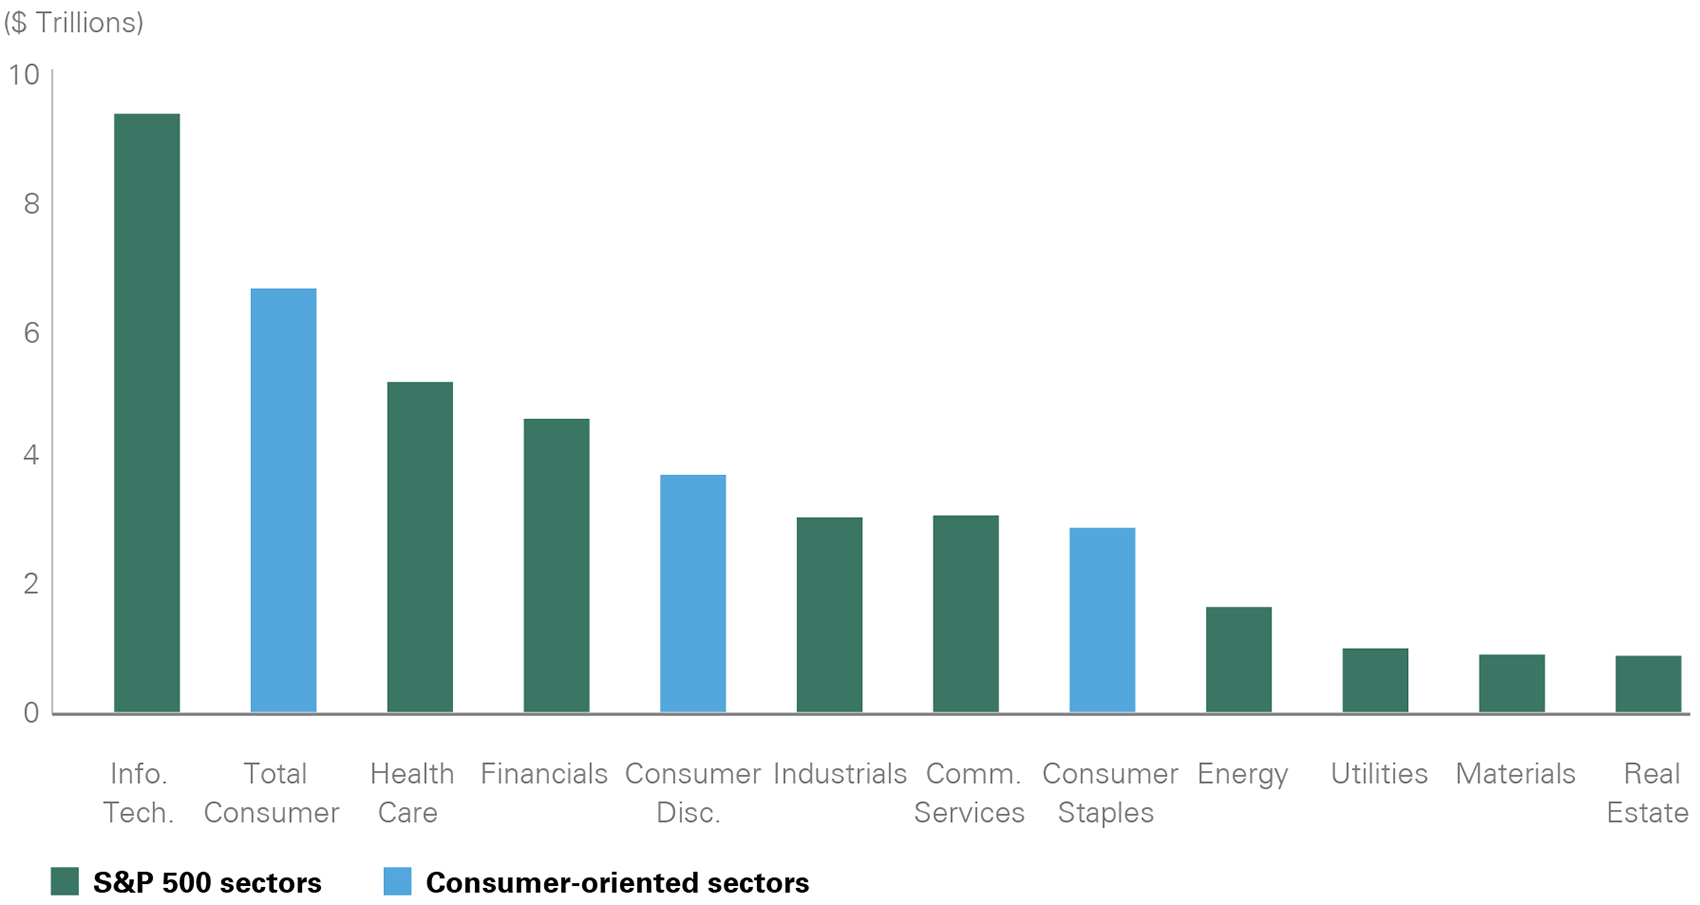
A bar chart illustrating market capitalizations for each sector of the S&P 500. Technology is shown as the largest sector, with the combined consumer-oriented sectors (consumer staples and consumer discretionary) nearly matching the tech sector’s total market cap. This visualization underscores the significant weight of consumer sectors within the broader equity market and contextualizes consumer behavior’s investment relevance.
Source: Bloomberg
Trade down. Signs are emerging that consumers are starting to tone down their purchases as excess savings dwindle and credit conditions tighten. Consumer staples companies such as Walmart and Costco have seen pressure on low-income consumers emerge through smaller basket sizes and opting for lower-priced alternatives. Walmart, a Bessemer holding, also reported a significant increase in credit usage from consumers who typically would not use credit. We believe that Walmart is well positioned to benefit from consumer trade down given the company’s attractiveness for price-conscious shoppers. BJ’s Wholesale, a holding in Bessemer’s U.S. Small Cap portfolio, saw its strongest membership renewal in history as consumers sought low-cost options.
Goods to services transition. Bessemer portfolios are well positioned to capture the shift in spending from goods to services; portfolios are underweight the household durables and automobile sectors, which have been negatively impacted by the continued pullback on big-ticket discretionary items. On the other hand, our portfolios are overweight hotels, restaurants, and leisure sectors, which have benefited from the strength in services spending. Bessemer holdings Visa and Mastercard highlighted in their earnings releases that cross-border recovery has accelerated above 2019 levels as travel demand remains robust. Meanwhile, strong travel demand has also benefited portfolio holding Hilton. Hilton noted in its first-quarter earnings report that it is not seeing any signs of a slowdown in demand.
High-end consumer resilience. Bessemer portfolios are overweight Louis Vuitton Moet and Hennessy (LMVH), which has benefited from resilient spending from higher-income consumers. The company reported a very strong sales update for the first quarter of 2023, exemplifying robust luxury spending from global consumers. More recently, LVMH has seen U.S. consumption slow, but we believe it remains well positioned to capture increasing tourism spend in Europe and Japan. However, pressure emerging at the higher income segments of the labor market could pose a risk to spending in the future.
Private markets. Many of the largest consumer companies by market capitalization are seasoned, making the space ripe for innovation. Mature consumer companies are often less focused on growth than profitability, and instead they often look to acquire up-and-coming brands to drive innovation. Within private markets, many newer companies are taking share from legacy brands, presenting attractive investment opportunities in smaller private companies. The up-and-coming brands have adapted to consumer engagement and have been able to quickly target the evolving consumer by shifting their advertising approaches. Additionally, as the consumer makes a conscious shift toward a healthy lifestyle, compelling opportunities have arisen in the healthy food, sneaker, and beauty segments. Interestingly, within the private market space, brick and mortar is not dead as many consumer brands tend to add an in-store presence following an online start.
Conclusion
Although consumer balance sheets have weakened, they remain a source of economic strength. The bifurcation in consumer spending between goods and services has become more prominent, and we believe that Bessemer portfolios are well positioned to capture these shifting trends. While the outlook for consumer spending is dependent on a variety of factors, the most important is the labor market, in our view. Currently, labor market strength is supporting consumer spending, though there has been some softening. We expect services spending to remain strong until there is a meaningful loosening within the labor market.
Past performance is no guarantee of future results. This material is provided for your general information. It does not take into account the particular investment objectives, financial situations, or needs of individual clients. This material has been prepared based on information that Bessemer Trust believes to be reliable, but Bessemer makes no representation or warranty with respect to the accuracy or completeness of such information. This presentation does not include a complete description of any portfolio mentioned herein and is not an offer to sell any securities. Investors should carefully consider the investment objectives, risks, charges, and expenses of each fund or portfolio before investing. Views expressed herein are current only as of the date indicated, and are subject to change without notice. Forecasts may not be realized due to a variety of factors, including changes in economic growth, corporate profitability, geopolitical conditions, and inflation. The mention of a particular security is not intended to represent a stock-specific or other investment recommendation, and our view of these holdings may change at any time based on stock price movements, new research conclusions, or changes in risk preference. Index information is included herein to show the general trend in the securities markets during the periods indicated and is not intended to imply that any referenced portfolio is similar to the indexes in either composition or volatility. Index returns are not an exact representation of any particular investment, as you cannot invest directly in an index.