Beyond Peak Uncertainty: Navigating a New Era of Tariffs

- Tariff levels are likely to remain structurally higher and are unlikely to fall meaningfully even if IEEPA-based tariffs are overturned.
- Tariffs are driving modest inflation in tariff-exposed goods categories, though overall pricing pressures are largely offset by easing core services and shelter costs.
- Companies are mitigating tariff impacts through pricing power, stockpiling, and diversification.
Since the start of the year, global trade has been disrupted by changing U.S. tariff measures and reciprocal responses, creating broad uncertainty. In 2025, tariffs have increasingly been used as instruments of geopolitical leverage, sparking legal disputes and prompting trade partners to counter and diversify their approaches. The U.S. trade landscape remains in flux, shaped by the Supreme Court’s current hearing on the International Emergency Economic Powers Act (IEEPA), ongoing bilateral negotiations, and active investigations across key sectors. While we believe the peak in uncertainty has passed, some unpredictability persists, and could increase after the Supreme Court’s IEEPA ruling. Still, regardless of the court’s decision, our base case is that tariff levels are likely to remain elevated relative to 2024, with an effective tariff rate in the mid-teens.
Tariff Update
The Trump administration imposed sweeping tariffs on key U.S. trading partners, including Canada, Mexico, China, Brazil, and India, with emerging markets bearing a disproportionate share of the impact. The effective U.S. tariff rate on emerging market exports has surged to nearly 20% (or about 13% excluding China) compared with roughly 4% (or 1% ex-China) before Trump 2.0.
In response, many countries have sought to negotiate new or revised trade agreements aimed at easing tariff pressures, but progress has been uneven. Most proposed deals remain at the framework stage with no published agreements, leaving significant implementation risks, particularly given divergent interpretations of key provisions. Moreover, no lasting or substantive deals have been reached with three of the United States’ largest trading partners, China, Canada, and Mexico, which together account for more than one-third of U.S. imports, nor with India or Brazil, both of which continue to face relatively high tariff burdens.
Legal challenges to U.S. trade policy are intensifying, with federal courts ruling that many of the IEEPA-based tariffs lack legal foundation and are unconstitutional. While the Supreme Court may not rule on IEEPA tariffs before 2026, the administration is already pursuing alternative legal pathways and introducing new sector-specific tariffs. Regardless of the ruling, in our view, President Trump is unlikely to retreat from his tariff agenda, and several other sources of authority remain available to sustain or expand these tariff measures — including Section 122, which permits temporary tariffs of up to 15%, country-specific Section 301 tariffs following investigation, and additional Section 232 tariffs on targeted sectors. All in all, even if the IEEPA tariffs are struck down, the overall tariff regime is unlikely to change meaningfully, in our view, with higher tariffs here to stay.
Trump’s 2018 vs. 2025 Tariffs
Trade and supply chains have been realigning since the tariffs introduced during Trump’s first term prompted many firms to begin diversifying away from China. A number of companies shifted production from China toward alternatives, such as Vietnam, Mexico, and India. As a result, China’s share of U.S. imports declined from more than 20% in 2017 to about 16% by 2022 (Exhibit 1), while countries such as Vietnam and Mexico gained share, with Vietnam nearly doubling its share of U.S. imports. This shift was particularly evident in consumer goods and electronics. Still, many U.S. manufacturers chose not to restructure at the time, viewing the risks of disruption as outweighing the costs of tariffs. Even where diversification occurred, supply chains often remained indirectly tied to China through intermediary countries dependent on Chinese components.
Exhibit 1: U.S. Imports from Mexico and China
Key takeaway: Tariff impacts are becoming more evident in global trade, with imports from China down over 20% in recent months. Separately, Mexican exports have held relatively steady as an estimated 85% comply with U.S.-Mexico-Canada trade agreement (USMCA) rules.
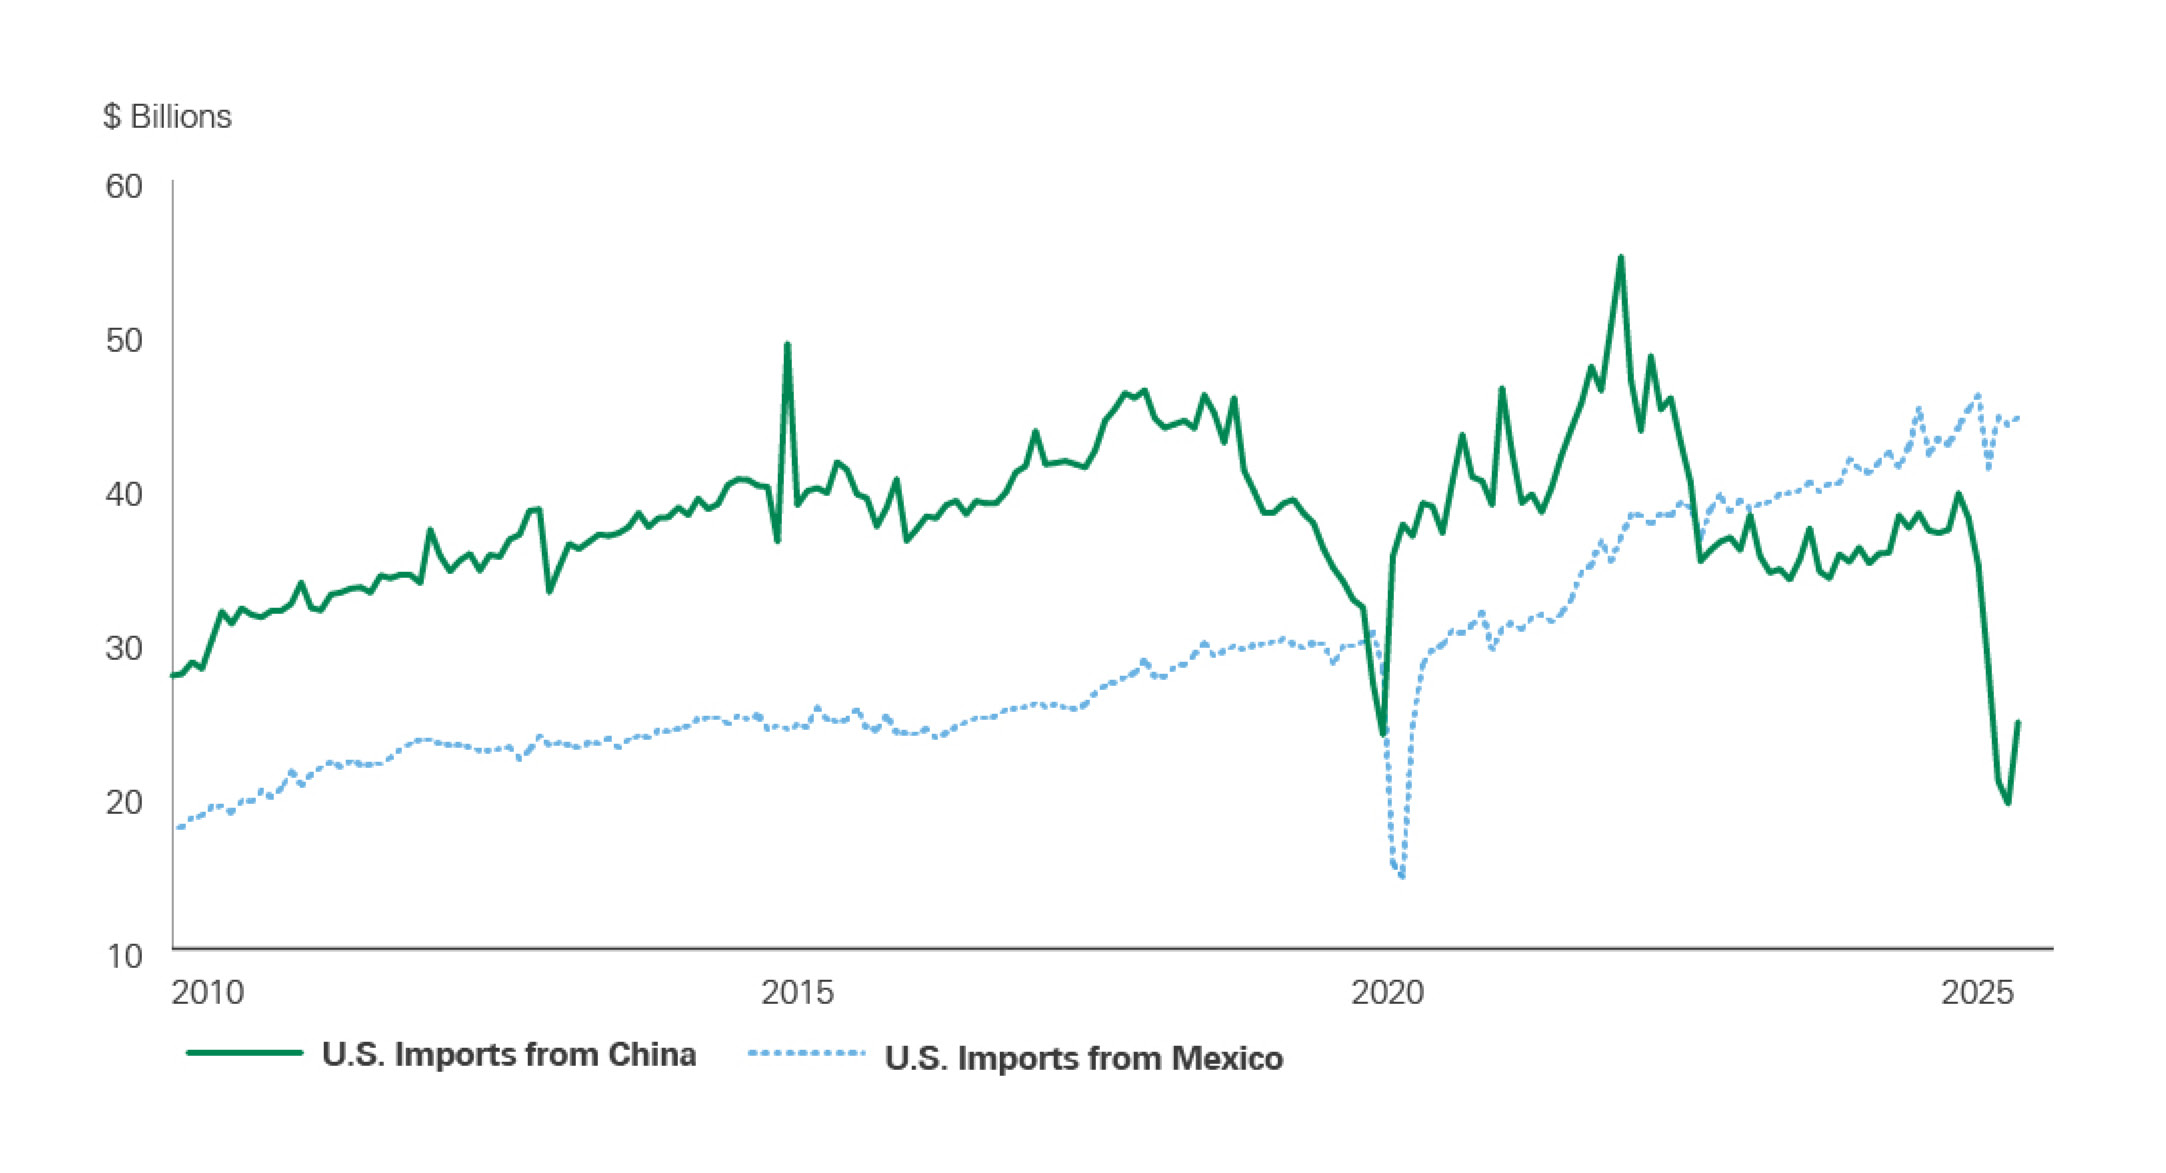
A chart showing the changing contribution of Mexico and China to total U.S. imports. It highlights that since Trump-era tariffs, China’s share of U.S. imports has declined significantly while Mexico’s share has remained relatively stable. The graphic illustrates how tariff policy has influenced sourcing and trade flows between major trading partners.
Trump’s 2025 tariff measures were broader, sharper, and less predictable than those of his first term, extending across strategic sectors such as autos, semiconductors, pharmaceuticals, and metals, and including a universal tariff as well as country-specific reciprocal tariffs. The scope of these actions created immediate uncertainty and pushed firms to respond decisively, with many accelerating imports ahead of tariff implementation. This produced a temporary surge in trade flows, with U.S. imports running roughly 25% above trend in the first quarter of 2025. However, the momentum quickly reversed, with imports dropping 18% month-over-month in April and another 4% in May, bringing volumes back in line with historical norms. At the same time, foreign direct investment patterns have begun to shift, as companies diversify away from heavily exposed markets such as China, Mexico, and Canada, and increasingly redirect capital toward Southeast Asia, including Vietnam, Thailand, and Indonesia, as well as parts of Latin America and the EU.
China
China was temporarily exempted from the latest round of tariffs, yet its effective tariff rate remains by far the highest among emerging markets. Current U.S. tariffs on Chinese goods, mirrored by Chinese tariffs on U.S. exports, have settled into what many view as a rough equilibrium at around 50%. This has emerged as a level that is punitive but not so high as to trigger full-scale decoupling. By contrast, a tariff burden closer to 70% is generally seen as a tipping point, rendering most Chinese exports uncompetitive and effectively shutting down bilateral commerce.
The key trade battleground lies in control of supply chain chokepoints. China’s near monopoly in critical minerals has strengthened its negotiating leverage; Beijing demonstrated this by cutting off exports of rare earth magnets in early 2025, forcing the U.S. administration to reconsider its escalation strategy. While tariffs have since stabilized and China has resumed rare earth shipments after recent negotiations, the concessions come with explicit warnings that they can be reversed at any time. The current U.S.-China truce should therefore not be mistaken for a lasting détente, in our view, but rather a temporary pause in a contest over strategic supply chains, while each side works to reduce their dependencies. Therefore, we expect to see continued flares in the U.S.-China relationship as each side attempts to flex their points of leverage, but are eventually restrained by their mutual interdependence.
India
The U.S. has become India’s largest export destination, now accounting for more than 20% of total exports, roughly double the share a decade ago. Yet India faces relatively high U.S. tariffs, which could rise further as the Trump administration pressures India over its oil purchases from Russia. India’s agricultural sector, employing nearly half the population and serving as a powerful political constituency, limits Prime Minister Modi’s flexibility in trade negotiations, since greater access for U.S. goods could threaten domestic farmers.
A key geopolitical risk is whether rising trade tensions push India closer to China and Russia, aligning more firmly with BRICS (Brazil, Russia, India, China, and South Africa). At the same time, U.S. tariffs threaten India’s only consistent export growth engine since the post-COVID period, though the macroeconomic impact may be modest given India’s domestically driven growth model, with goods exports at just 11% of GDP and U.S. sales at about 2%. Looking ahead, the government is pursuing reforms to expand manufacturing and exports, with the ambition of growing total goods and services exports to $2 trillion by 2030 from about $830 billion today. Because of India’s export-driven growth ambitions, we believe it will be difficult for India to fully align with BRICS at the expense of its U.S. relationship.
Mexico
Mexican exports are uniquely tied to the U.S., with nearly 85% of shipments headed north, equivalent to about 30% of Mexico’s GDP, marking the highest dependence on a single market among major economies. Most exports remain duty-free under the USMCA, and the effective U.S. tariff rate on Mexican goods is just over 4%, among the lowest rates for any major trading partner.
Trump’s tariff structure has generally favored countries closest to North American supply chains, with Mexico and Canada positioned as the biggest beneficiaries relative to peers, in contrast to the higher rates imposed on Europe, Asia, and BRICS economies. This has reinforced Mexico’s role in the nearshoring trend, which accelerated post-pandemic and drove a surge in foreign direct investment and manufacturing activity.
At the same time, Trump 2.0 has eroded Mexico’s relative advantage, as trade deals increasingly pressure foreign firms to invest directly in the U.S., signaling a shift from nearshoring to onshoring. Looking ahead, a key uncertainty is whether the USMCA will be revised in its scheduled July 2026 review. We think an underappreciated risk is that the U.S. seeks bilateral vs. trilateral agreements, creating fragmentation of the regional bloc and additional supply chain uncertainty.
Who Eats the Tariff
The question of who ultimately bears the cost of U.S. tariffs is starting to become clearer. Import prices, excluding tariffs, have been flat to slightly higher relative to trend; meanwhile, foreign-currency import prices fell in early 2025 but only to mid-2024 levels, suggesting limited concessions from exporters. It does not appear that foreign suppliers are broadly discounting goods to offset tariffs, meaning the costs are falling largely on U.S. firms and consumers.
Estimates suggest that roughly 40% of tariff costs are passed directly to households through higher retail prices, with the remainder split between importers and foreign exporters (Exhibit 2). Businesses, particularly manufacturers and retailers reliant on imported inputs, face higher costs and supply chain disruptions, while households see higher prices at checkout. Although recent retail sales reports show nominal spending growth, inflation-adjusted data reveal weaker underlying consumer demand, raising the question of whether households can continue absorbing the added costs. In our view, this dynamic is likely to place added pressure on the low-end consumer, creating further consumer bifurcation.
Exhibit 2: Business Pass-Through of Tariffs
Key takeaway: Most businesses have passed through some or all of the tariffs, with the remainder split between importers and foreign exporters.
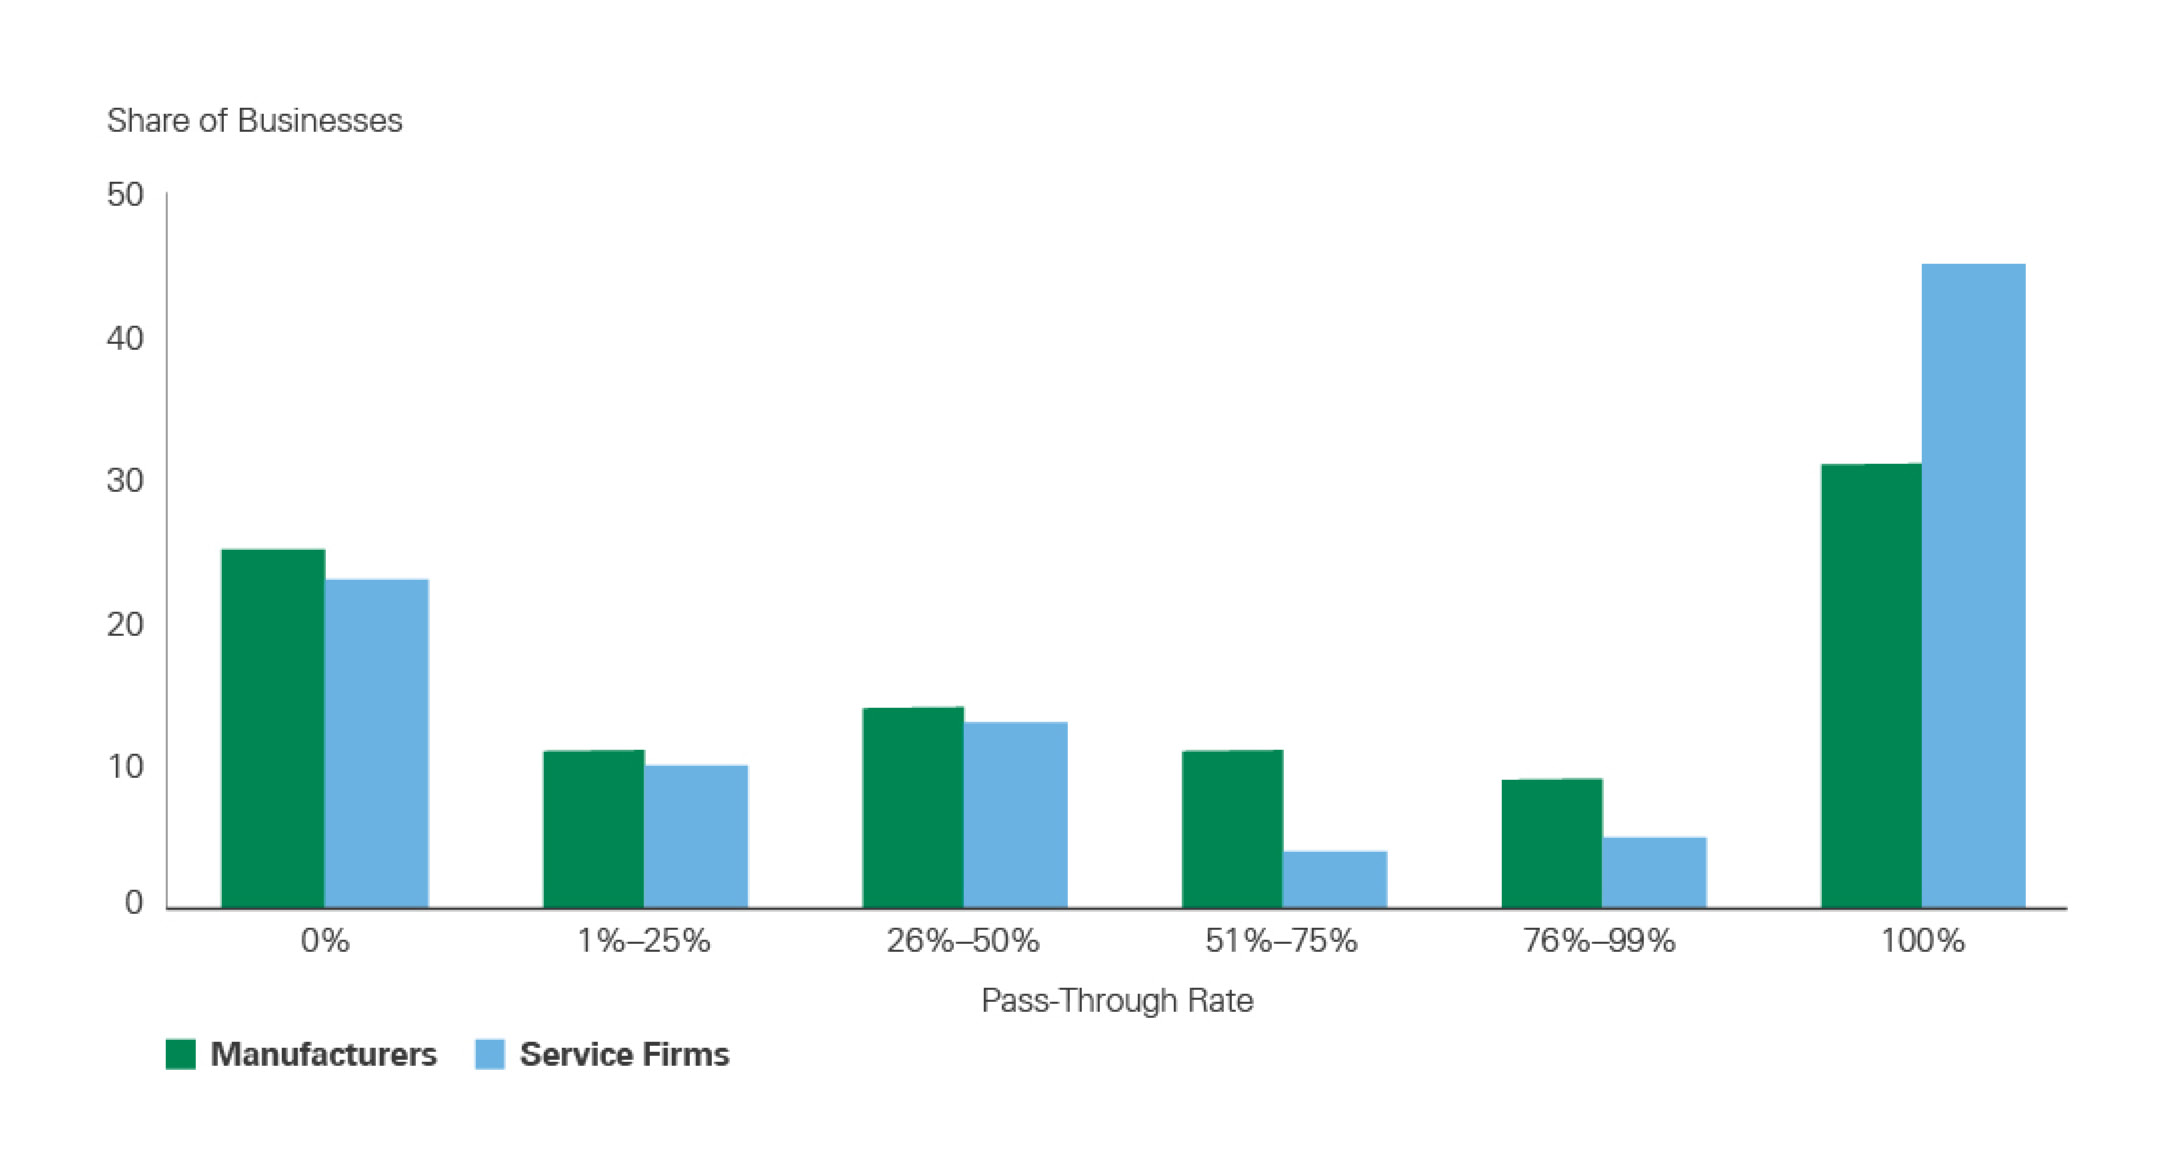
An exhibit illustrating the division of tariff cost burdens between importers, foreign exporters, and U.S. households. It shows that a significant portion of tariff costs gets passed through to consumers via higher retail prices, with the remainder split between importers and foreign exporters. This visualization helps clarify who ultimately bears the financial impact of tariff measures.
U.S. inflation dynamics are increasingly being influenced by tariffs, with core goods prices running about 2% above the pre-2025 trend, led by categories such as appliances, apparel, electronics, and household goods. Still, tariffs directly or indirectly affect only about 15% of the consumer price basket (Exhibit 3), and the resulting pressure has been broadly offset by disinflation in core services and shelter. Therefore, we do not expect tariffs to spur broad-based inflation, and accordingly, we believe the Fed should continue to ease monetary policy given the softening labor market.
Exhibit 3: CPI Weights of Core Components
Key takeaway: While some tariff-impacted areas are seeing price pressures, the gradual easing in shelter prices can balance out potential pressure on goods prices as shelter holds the largest weight in the index.

A chart breaks down the weight of core CPI components, comparing goods categories directly affected by tariffs (such as apparel, household items, transportation equipment) with core services and shelter. It shows that while tariff-impacted goods have experienced price pressures, these categories represent a smaller share of total CPI than core services, helping explain why aggregate inflation may not be broadly elevated.
Sector and Company Impacts
While tariffs continue to drive above-trend pressures in several goods categories, the pass-through has been more gradual as firms work down excess inventories and adopt mitigation strategies. These strategies typically fall into several categories: exercising pricing power, negotiating with suppliers, redirecting products to non-tariffed markets, stockpiling inventory, and diversifying supply chains.
Recent company earnings reports underscore these dynamics. Pricing power has overtaken diversification as the most frequently cited approach, given the high costs and extensive time involved in restructuring supply chains. Tariffs have introduced volatility into demand forecasting and inventory planning, leaving just-in-time delivery models particularly exposed. Many firms have responded by pausing or canceling orders, renegotiating terms, or building buffers against future disruptions. Increasingly, companies are shifting toward just-in-case systems, stockpiling goods and sacrificing efficiency in favor of supply security. Tariffs have pushed companies to accelerate nearshoring and friend-shoring, with retailers such as Home Depot, Costco, Williams-Sonoma, and Walmart shifting production to Mexico, the U.S., and trusted Southeast Asian partners.
In terms of sectors, industrials continue to emphasize pricing power and supplier negotiations; consumer discretionary firms highlight inventory stockpiling; and healthcare companies focus on supplier flexibility. Retailers and manufacturers face strain, balancing higher input costs, supply chain disruptions, and the trade-offs between raising prices, cutting product lines, or absorbing losses.
Some technology firms have felt a notable impact. Apple acknowledged nearly $300 billion in lost market value due to steep tariffs on Chinese goods and rising trade hostilities. While some pre-buying softened the immediate hit, the company faces lasting structural headwinds and is accelerating its “China +1” strategy, with India and Vietnam emerging as major hubs. Apple aims to shift all U.S.-bound assembly to these countries by 2026.
Autos and consumer goods are under similar strain. Some global auto manufacturers, including Ford and Porsche, have trimmed profit forecasts in response to higher costs and disrupted supply chains. GM expects a $4–$5 billion revenue hit tied to tariffs, while Harley-Davidson has withdrawn its full-year outlook, citing uncertainty around metals costs. Walmart has already raised prices in categories such as electronics and toys, noting that tariff reductions have not provided sufficient relief, while Kimberly-Clark is pursuing selective price hikes and cost controls. Nike, meanwhile, is reallocating sourcing, with U.S. footwear imports from China expected to fall from about 16% to the high single digits by 2026.
Tariff uncertainty has also encouraged investment in automation and more agile fulfillment models, replacing bulk shipments with smaller, demand-responsive flows. This reflects a broader strategy to regionalize supply chains, reduce reliance on China, and build greater resilience. Looking ahead, while AI adoption has not yet been explicitly positioned as a tariff mitigant, productivity gains from artificial intelligence could emerge as a meaningful offset to tariff-related pressures over time.
Portfolio Positioning
Bessemer portfolios are focused on managing position size in companies exposed to tariff headwinds. For example, a Bessemer All Equity portfolio remains underweight Apple relative to its benchmark, in part due to tariff-driven challenges. Similarly, portfolio managers decreased exposure to BJ’s Wholesale, given tariff-related inflation and the need for incremental pricing.
Meanwhile, portfolio managers are investing in companies that are either resilient to the impacts of tariffs or that have been able to successfully implement tariff-mitigation strategies. Bessemer portfolios shifted positioning within the semiconductor industry to decrease NXP Semiconductors, which has greater exposure to international auto OEMs and the Chinese supply chain, and to increase Applied Materials and ASML, which are less sensitive to import tariffs.
From an overall portfolio perspective, U.S. risk assets have shown limited sensitivity to tariff developments and related legal challenges since Liberation Day, suggesting markets are largely discounting further escalation. Part of this disconnect reflects index composition: the sectors most directly exposed to tariffs (particularly consumer discretionary, which has the heaviest sourcing exposure to tariffed regions and relatively weak pricing power) represent only a modest share of the S&P 500. Given this, we continue to underweight consumer discretionary within U.S. equities while maintaining an underweight stance on emerging markets relative to benchmarks, where the earnings drag from tariffs remains more material (Exhibit 4).
Exhibit 4: All Equity Sector and Regional Weights
Key takeaway: Bessemer equity portfolios are underweight consumer discretionary and emerging markets relative to benchmarks.
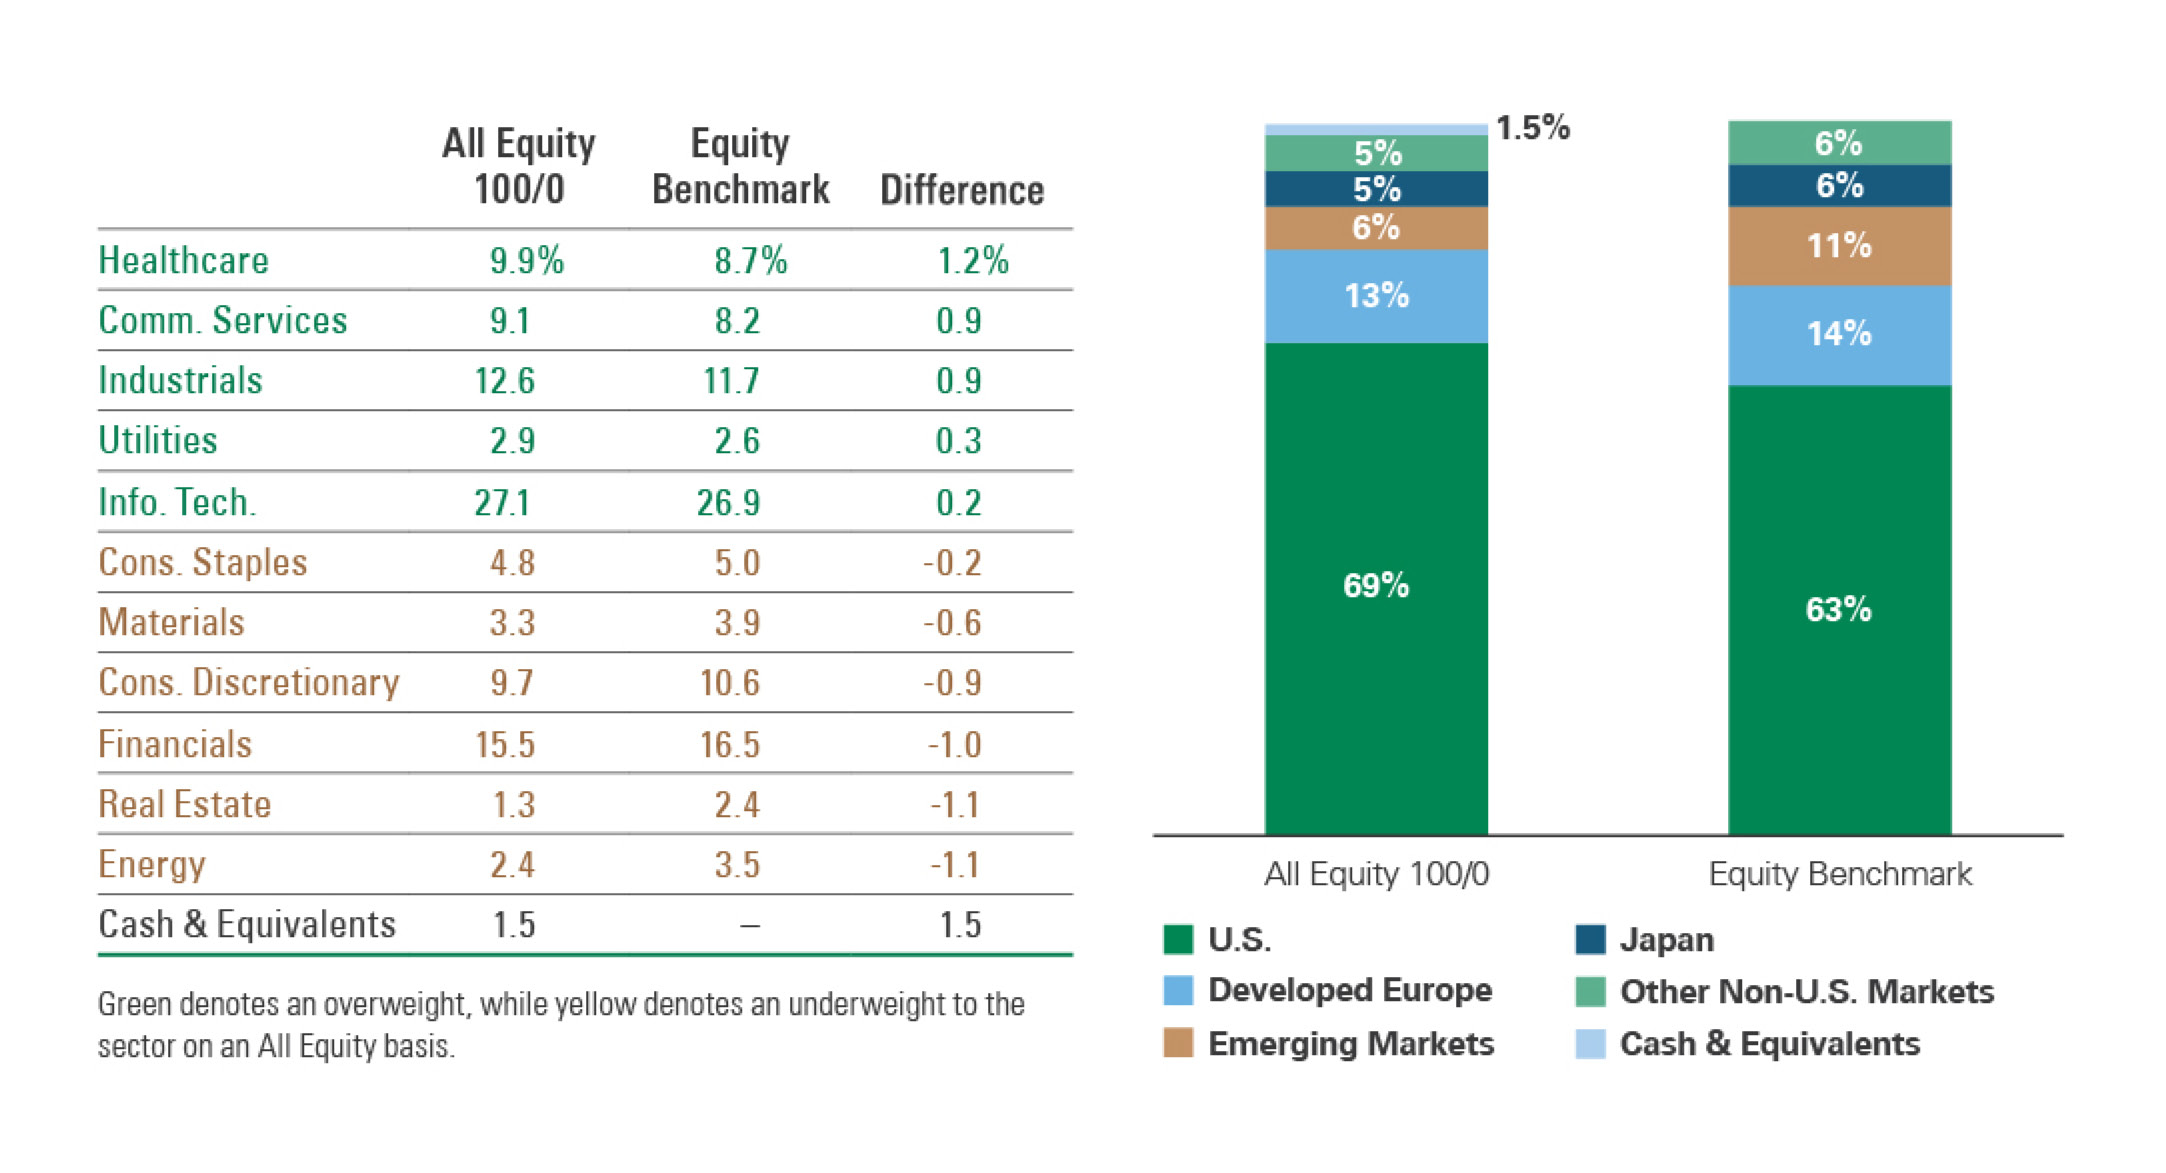
A chart showing how Bessemer’s All Equity portfolios are positioned relative to benchmarks across sectors and regions. It highlights that portfolios are underweight in consumer discretionary and emerging markets due to tariff-related pressures, while overweight in sectors less sensitive to tariff headwinds. This graphic provides insight into portfolio positioning strategy in response to macro headwinds from tariffs.
As of October 31, 2025. Source: Bessemer, FactSet
Past performance is no guarantee of future results. This material is provided for your general information. It does not take into account the particular investment objectives, financial situations, or needs of individual clients. This material has been prepared based on information that Bessemer Trust believes to be reliable, but Bessemer makes no representation or warranty with respect to the accuracy or completeness of such information. This presentation does not include a complete description of any portfolio mentioned herein and is not an offer to sell any securities. Investors should carefully consider the investment objectives, risks, charges, and expenses of each fund or portfolio before investing. Views expressed herein are current only as of the date indicated and are subject to change without notice. Forecasts may not be realized due to a variety of factors, including changes in economic growth, corporate profitability, geopolitical conditions, and inflation. The mention of a particular security is not intended to represent a stock-specific or other investment recommendation, and our view of these holdings may change at any time based on stock price movements, new research conclusions, or changes in risk preference. Index information is included herein to show the general trend in the securities markets during the periods indicated and is not intended to imply that any referenced portfolio is similar to the indexes in either composition or volatility. Index returns are not an exact representation of any particular investment, as you cannot invest directly in an index. Alternative investments, including private equity, real assets and hedge funds, are not suitable for all clients and are available only to qualified investors.