Financing the AI Buildout: What It Means for Corporate Bond Markets
AI infrastructure spending is reshaping investment grade (IG) credit markets. The six largest hyperscalers now represent 5.1% of the market, up from 2.4% a year ago. Moreover, these issuers represent more than 10% of the market risk based on a combined measure of interest rates and credit spreads, up from just 3.7% last year.
Credit selection remains critical. Many companies can sustain higher debt levels, but risks around infrastructure longevity, AI adoption, and vendor financing and investment warrant monitoring. Potential regulatory changes following the midterm elections could slow data center construction, leading to a more measured pace of credit expansion.
We remain cautious about adding exposure until AI economics become clearer. We prefer senior credit obligations while exercising caution around contractually subordinated, off-balance-sheet, or direct asset risks.
Market Impact: More Bonds, Wider Credit Spreads
The U.S. dollar IG bond market has fundamentally changed amid the surge in new supply during 2026. On a year-to-date basis, the six major hyperscalers1 have issued more than $250 billion in 2026 versus just $93 billion in 2025 and only $19 billion in 2024. This has led to wider credit spreads for the cohort with differentiation based on quality (Exhibit 1). Much of the credit-specific concern can be attributed to two issuers, Oracle and SpaceX, both of which exhibit more aggressive financial profiles. Meta occupies a middle ground while spread levels on the three higher quality hyperscalers have seen much more modest movements.
Exhibit 1: Hyperscaler Daily Median Credit Spread (2026 YTD)
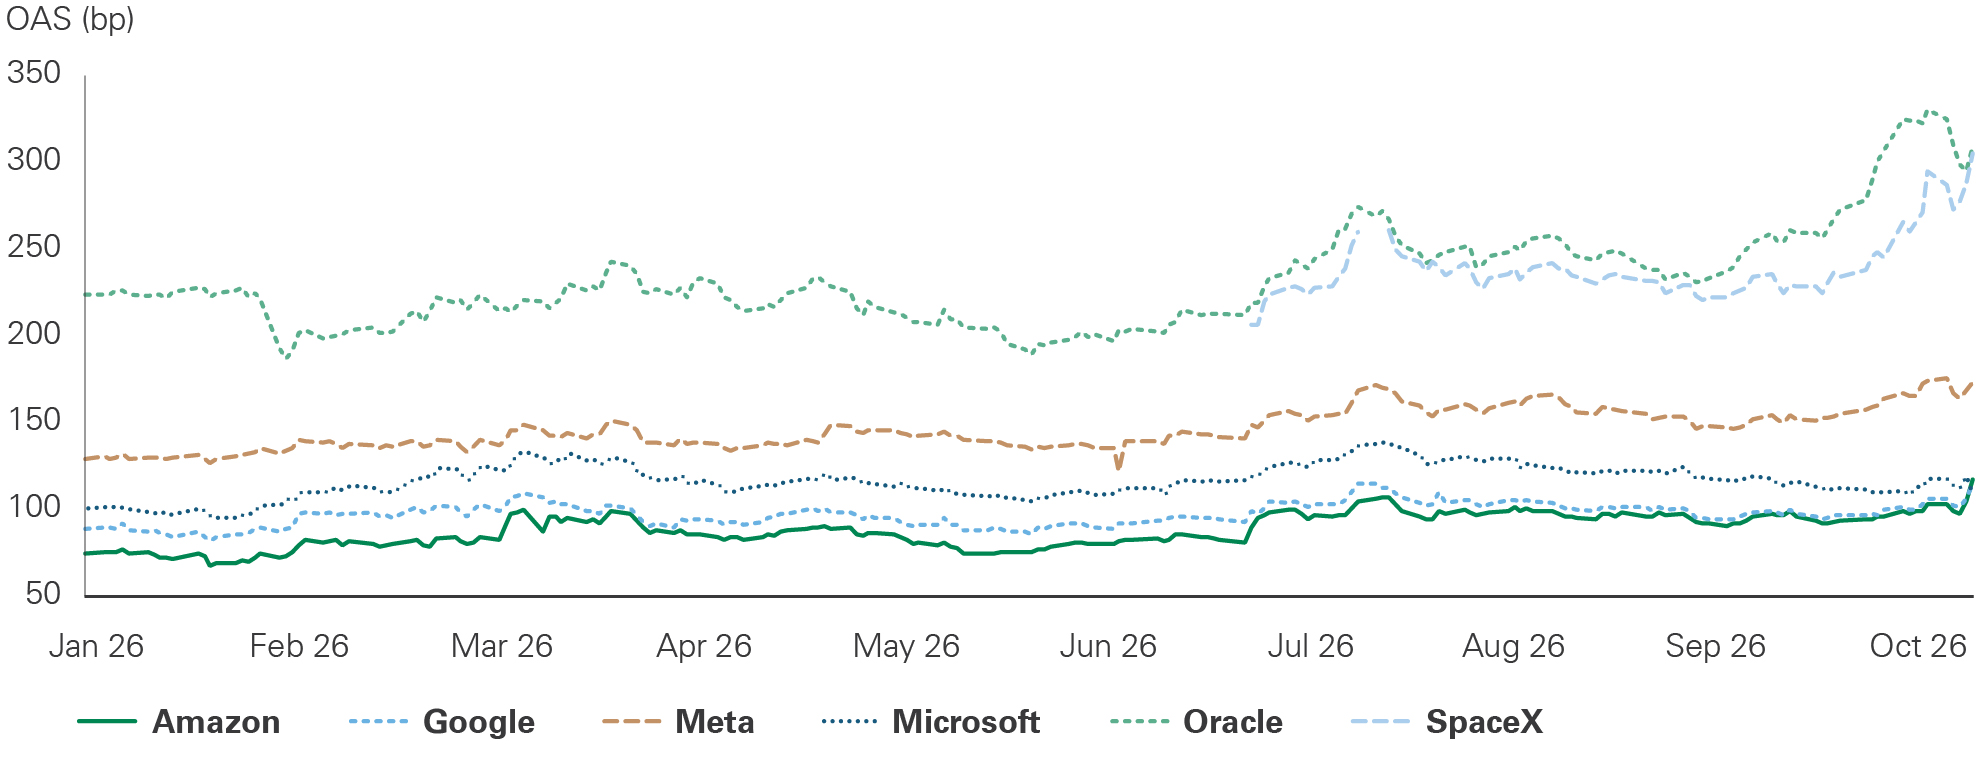
Line chart showing option-adjusted spreads in basis points for Amazon, Google, Meta, Microsoft, Oracle, and SpaceX from January through October 2026. Oracle’s spread starts near 225 basis points, falls below 200 in May, and peaks near 330 in October before ending around 300. SpaceX’s series begins in late June near 205 basis points and ends around 300. Meta’s spread increases from approximately 130 to 170 basis points. Amazon and Google start near 75 and 90 basis points, respectively, and finish around 115. Microsoft starts near 100 basis points, peaks around 140 in July, and also ends around 115. Oracle and SpaceX show the largest spread increases toward the end of the period. Values are approximate.
Source: Bloomberg
Meanwhile, the structure of the IG market has also changed. The six-name hyperscaler cohort increased from 2.4% of the market a year ago to 5.1% currently. And with 46% of hyperscaler bonds maturing in more than 10 years, this exposure will remain in the index for many years. As a result, hyperscalers contribute more risk than their share of market value would imply. Measured by duration times spread (DTS), which captures combined duration and credit risk, hyperscalers represent 10.3% of the index’s DTS, up from just 3.7% a year ago (Exhibit 2).
What Is DTS?
DTS is a measure that aggregates a bond’s duration and credit risk into one figure for a total risk measure. It is calculated as spread duration multiplied by credit spread. Multiplying DTS by the percentage change in credit spreads gives the approximate percentage change in price. This means that, for a given duration, bonds with wider spreads could experience greater price movements if credit spreads adjust proportionally. For example, a bond with a duration of 7 and credit spread of 100 basis points has a DTS of 700. If credit spreads widen 20%, the bond’s price will decline 1.4%. By comparison, a bond with a duration of 7 and a credit spread of 200 basis points will have a DTS of 1,400 and will decline 2.8% for the same spread movement.
Exhibit 2: Hyperscalers’ Contribution to Market Risk Has Increased
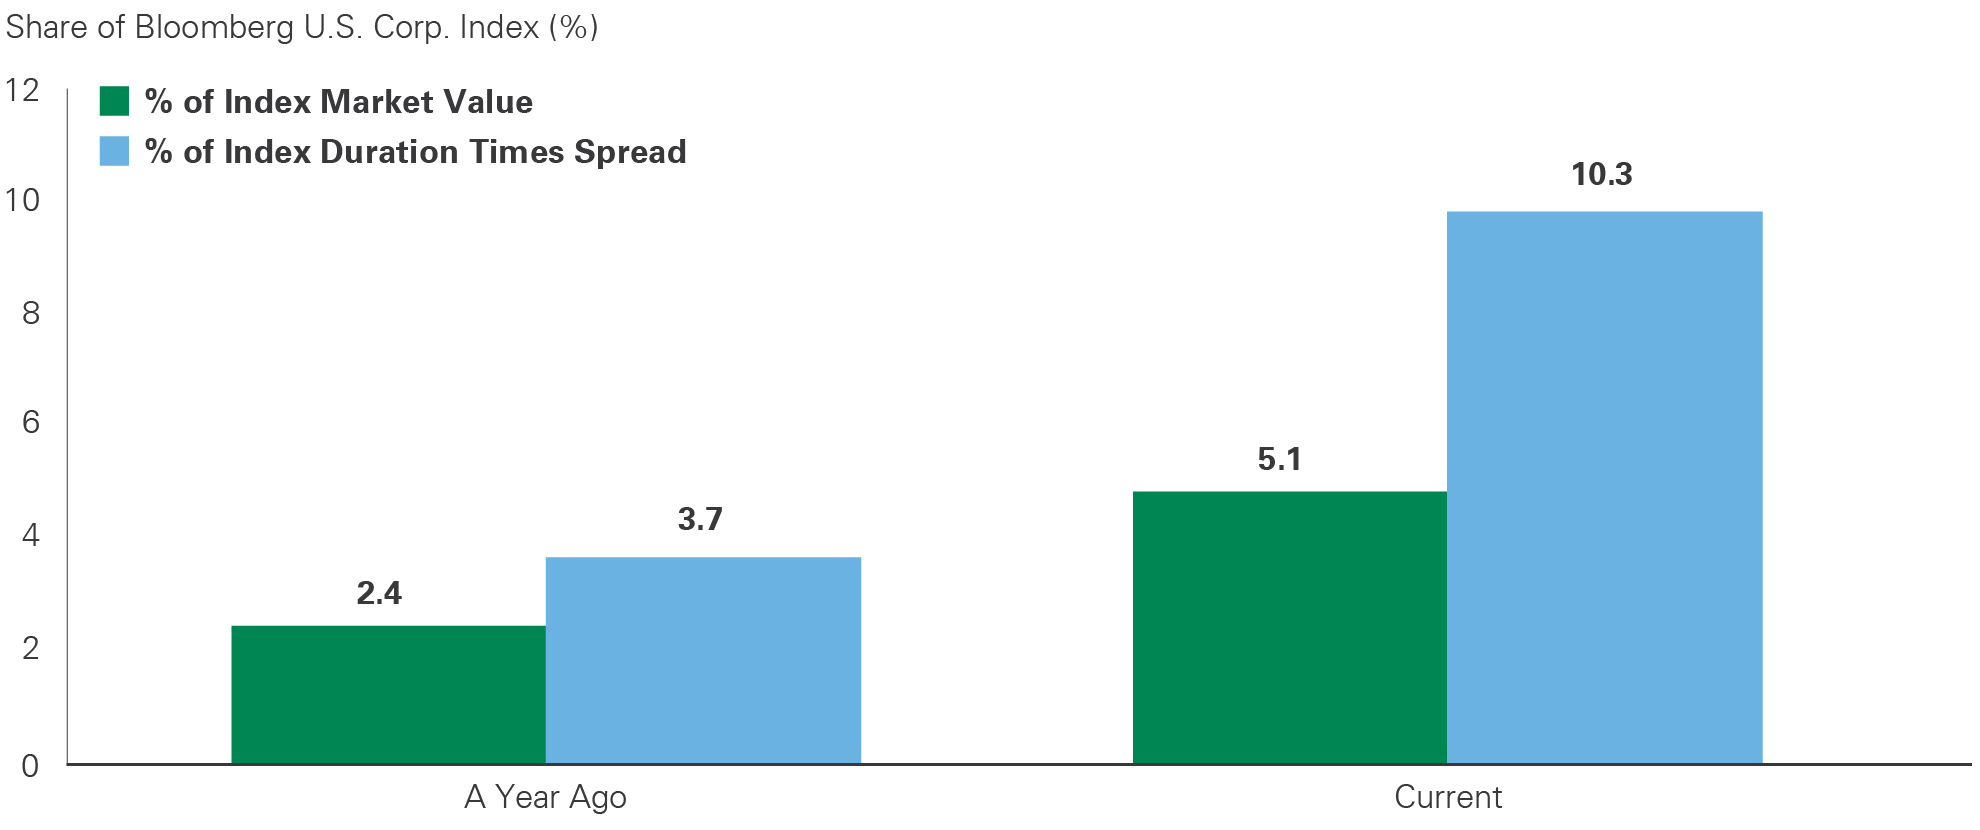
Grouped bar chart comparing the measured group’s share of the Bloomberg U.S. Corporate Index a year ago and currently. Green bars show its share of index market value increasing from 2.4% to 5.1%. Blue bars show its share of index duration times spread increasing from 3.7% to 10.3%. Both measures more than double. The duration-times-spread share exceeds the market-value share in both periods and is approximately twice the market-value share currently.
Source: Bloomberg U.S. Corporate Index (LUACTRUU), firm calculations
We expect wider credit spreads on hyperscaler debt to persist for the near term, given expectations that spending will outstrip cash flow, resulting in high ongoing issuance. Issuance is expected to increase in 2027 and 2028, albeit at a slower rate of growth than in 2026. The timing of issuance is difficult to predict, which sustains the spread premium on the sector. Despite the magnitude of issuance thus far, we have observed reasonably responsible financing behavior with companies utilizing multiple funding markets (including equity), pausing after heavy issuance, and offering some market communication regarding plans and intentions.
Credit Quality: A Strong Starting Point but Needs Watching
The higher quality borrowers have the resources to manage the AI investment cycle. Their legacy businesses can accommodate rising leverage. However, these assumptions warrant monitoring, particularly where achieving financial targets depends on realizing returns from new AI investments.
Investment returns on the AI buildout are only starting to emerge, though anecdotal reports of revenue and productivity gains are frequent. Most of the buildout has been contracted, though revenue recognition does not occur until the assets are delivering compute capacity, often to a model builder like Anthropic or OpenAI. Hence, we get the eye-popping figures like Oracle’s contracted-but-not-yet-recognized revenue of $664 billion as of the first quarter of 2027. This future revenue (and conversion to hyperscaler earnings) relies on model builders successfully selling AI inferencing software and services to companies and individuals. The amount of compute capacity needed remains uncertain. Data illustrating the economics of the buildout — such as return on investment, capacity utilization, and price elasticity — is often either not disclosed or embedded within results of larger business units.
That being said, the hyperscalers can lean on legacy business lines — most of which generate substantial cash flow — to fund the buildout. Google has advertising and cloud; Amazon has retail, cloud, and advertising; Meta has advertising; Microsoft has cloud and software; Oracle has cloud and software; and SpaceX has satellites and rocketry. Results for the six companies continue to be strong with high rates of growth providing cushion for additional debt (Exhibit 3).
Exhibit 3: Strong Growth From Existing Business Lines
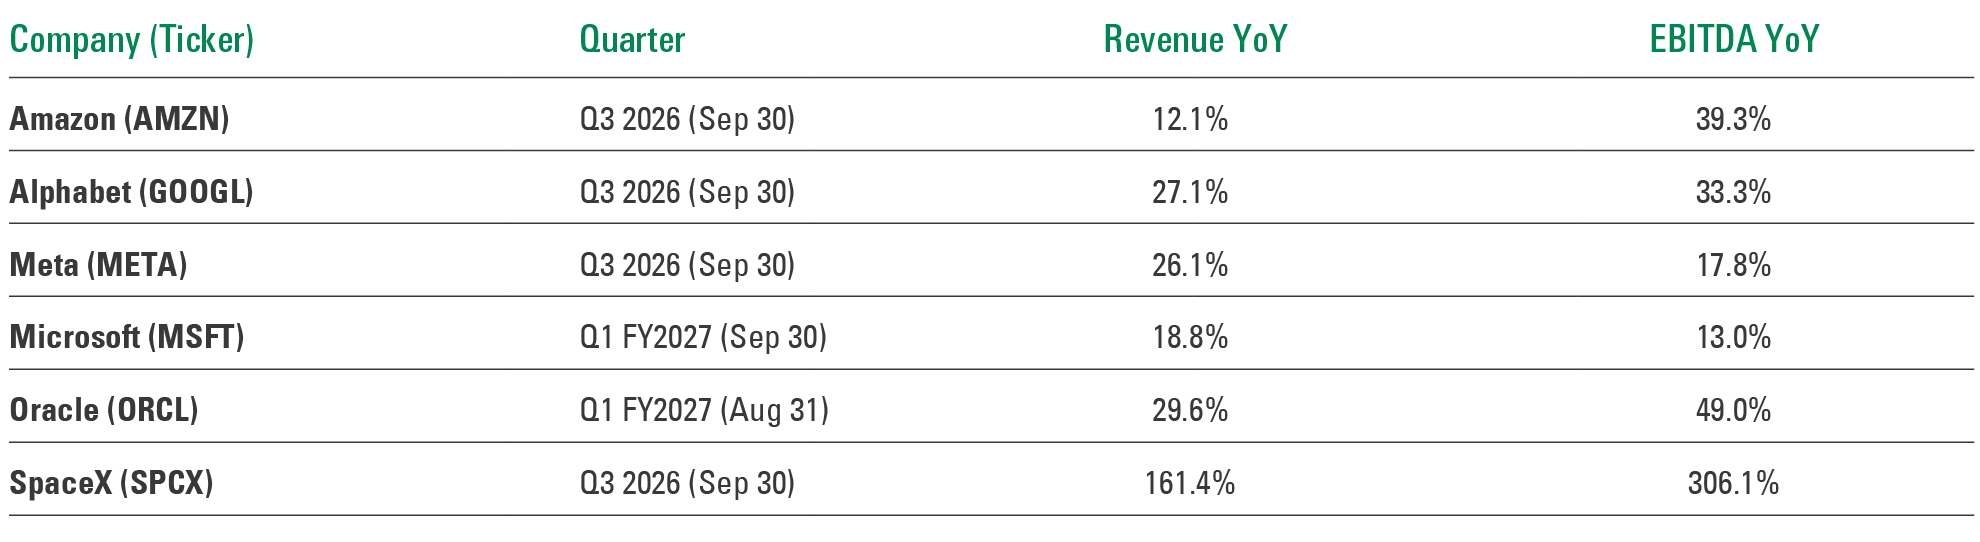
Table showing year-over-year revenue and EBITDA growth for Amazon, Alphabet, Meta, Microsoft, Oracle, and SpaceX. EBITDA means earnings before interest, taxes, depreciation, and amortization. For the third quarter of 2026, ended September 30, Amazon (AMZN) has revenue growth of 12.1% and EBITDA growth of 39.3%; Alphabet (GOOGL), 27.1% and 33.3%; Meta (META), 26.1% and 17.8%; and SpaceX (SPCX), 161.4% and 306.1%. For the first quarter of fiscal 2027, ended September 30, Microsoft (MSFT) has revenue growth of 18.8% and EBITDA growth of 13.0%. For the first quarter of fiscal 2027, ended August 31, Oracle (ORCL) has revenue growth of 29.6% and EBITDA growth of 49.0%. All six companies show positive growth in both measures, with SpaceX showing the largest increases.
Source: Company filings
Most hyperscalers also start from strong balance sheet position, with very low leverage. However, cohort capital expenditure is estimated at roughly $863 billion in 2026 and projected to rise approximately 50% to $1.3 trillion in 2027. This spending will comfortably exceed forecasted cash flow of $975 billion2, a highly unusual dynamic for these companies that will likely lead to continued debt financing. Furthermore, we expect companies to continue employing alternatives to public debt financing, which can help manage capital market activity as well as add complexity to credit analysis. These alternatives include use of off-balance sheet lease financing and contingent obligations. For example, as of the second quarter of 2026, combined off-balance-sheet lease commitments from the hyperscalers are roughly $1.1 trillion, more than twice as much as reported long-term debt. Lease terms, including cancellation provisions, are often not disclosed. The ultimate timing and value of contingent obligations are uncertain.
A notable example is Meta’s financing of data centers in Louisiana and Texas. While Meta is only a minority owner of these projects, it leases the facilities and provides residual value guarantees (RVGs). RVGs only become recognized liabilities if Meta decides not to renew its lease. The RVG is dependent on the data center’s economic value at that time. Meta reports total potential data center financing exposure of $68 billion, of which only $4.7 billion was on-balance-sheet exposure in the form of minority ownership interests, while the remaining $63.3 billion represents lease and potential RVG obligations.
Four developments we are monitoring:
Midterm election outcomes. The pace of the AI buildout has been largely unrestricted, limited only by physical and financial capital as well as certain local regulatory constraints. With Democrats gaining control of Congress in the midterm elections, regulatory scrutiny of data center construction could increase, potentially slowing the pace of development. We expect projects already underway to continue but moratoriums in some states to lead to delays or cancellations. Importantly, a moratorium is temporary. However, the timing and conditions for lifting these restrictions remain uncertain as policymakers address environmental and power-grid impacts. In addition, some projects may shift to states with more hospitable regulatory environments. This has the potential to move the pace of development toward the traditional sweet spot for IG credit of “not too hot, not too cold” as near-term demand for credit moderates. However, project delays could also defer revenues and increase project costs, reinforcing the importance of existing cash flows to cushion the impact of delays. And a more measured pace of construction could also reduce the incentives for more aggressive use of balance sheets. Finally, it may also allow the AI adoption patterns to deepen and broaden, better demonstrating the economic benefits.
Hyperscaler assumptions on the useful lives of their AI assets will have a direct bearing on reported profitability and cash flow. The expected useful lives and terminal values of AI infrastructure remain open questions. Servers and networking are depreciated over roughly five or six years by the hyperscalers. Excluding SpaceX, which only became public this year, the other five hyperscalers mostly lengthened these useful lives between 2022 and 2025. Assumptions of longer economic lives lowers annual depreciation and raises reported earnings. For example, in 2025, Meta lengthened most server and network asset lives to 5.5 years, exceeding the previous range of 4 to 5 years and adding $2.6 billion to net income. An exception was Amazon, which reduced expected useful life on a subset of equipment from 6 years to 5 years, citing the pace of technological development. This reduced net income by $1.0 billion.
More conservative (shorter) useful life assumptions help account for faster-than-expected technology obsolescence. In this scenario, assets would need to be replaced sooner than their depreciation schedules imply. Replacement capex would run ahead of depreciation, resulting in surging cash outflows and overstating sustainable earnings. Ultimately, a company could be forced to recognize an earnings hit in the form of accelerated depreciation resulting from shortened useful lives, losses on early retirement, or impairment charges.
Observable measures of AI demand show continued increases in AI adoption, although it remains early in the development of the market. Adoption measures include the U.S. Census Bureau’s Business Trends and Outlook Survey (BTOS) and the St. Louis Fed Real-Time Population Survey. The October 22 BTOS shows almost 25% of respondents using AI, up from 17% in November 2025 (Exhibit 4). And the third-quarter 2026 St. Louis Fed Real-Time Population Survey reports an overall adoption rate of 61%, a modest decline from the second quarter but an increase from 45% two years ago (Exhibit 5). Both surveys are relatively new and use different methodologies. There is no guarantee they fully capture the economic uptake of AI. But they have become useful market signals. Finally, while there is debate over whether the AI buildout is a bubble, it may simply be a matter of timing. The fiber infrastructure buildout of the 1990s was considered an overbuild for many years but was eventually utilized as data consumption grew into the supply.
Exhibit 4: U.S. Businesses Using AI (% of firms)
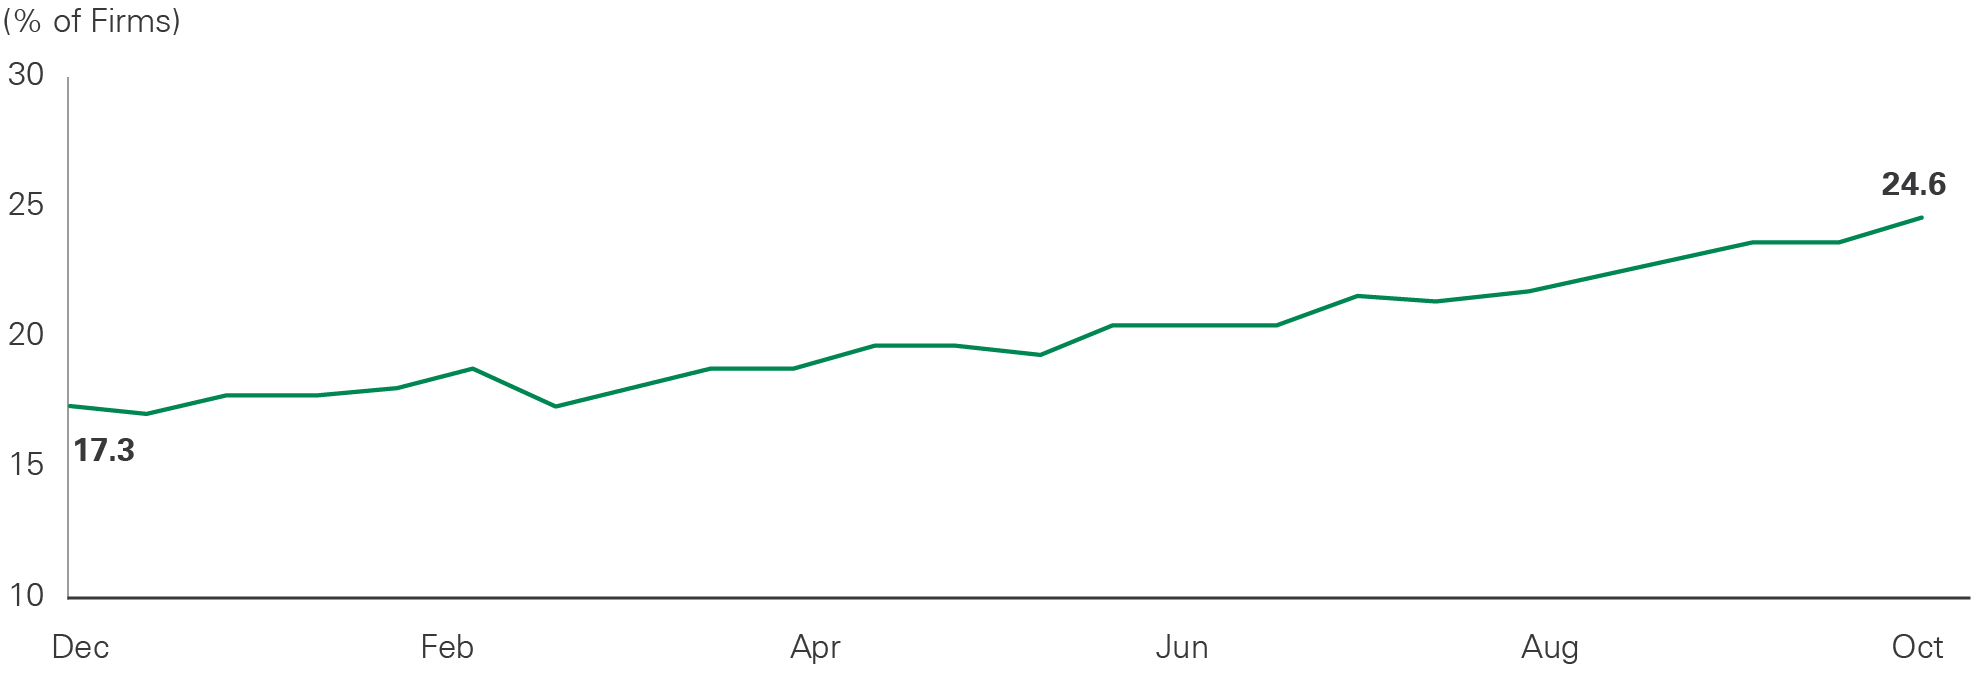
Line chart showing a percentage of firms from December through October. The percentage begins at 17.3%, fluctuates around 17% to 19% early in the period, and reaches approximately 20% by May. It continues rising through the later months, reaching roughly 22% in August and ending at 24.6% in October. Despite several brief declines and periods of little change, the overall increase is 7.3 percentage points.
Exhibit 5: Generative AI Adoption, Working-Age Adults (%)
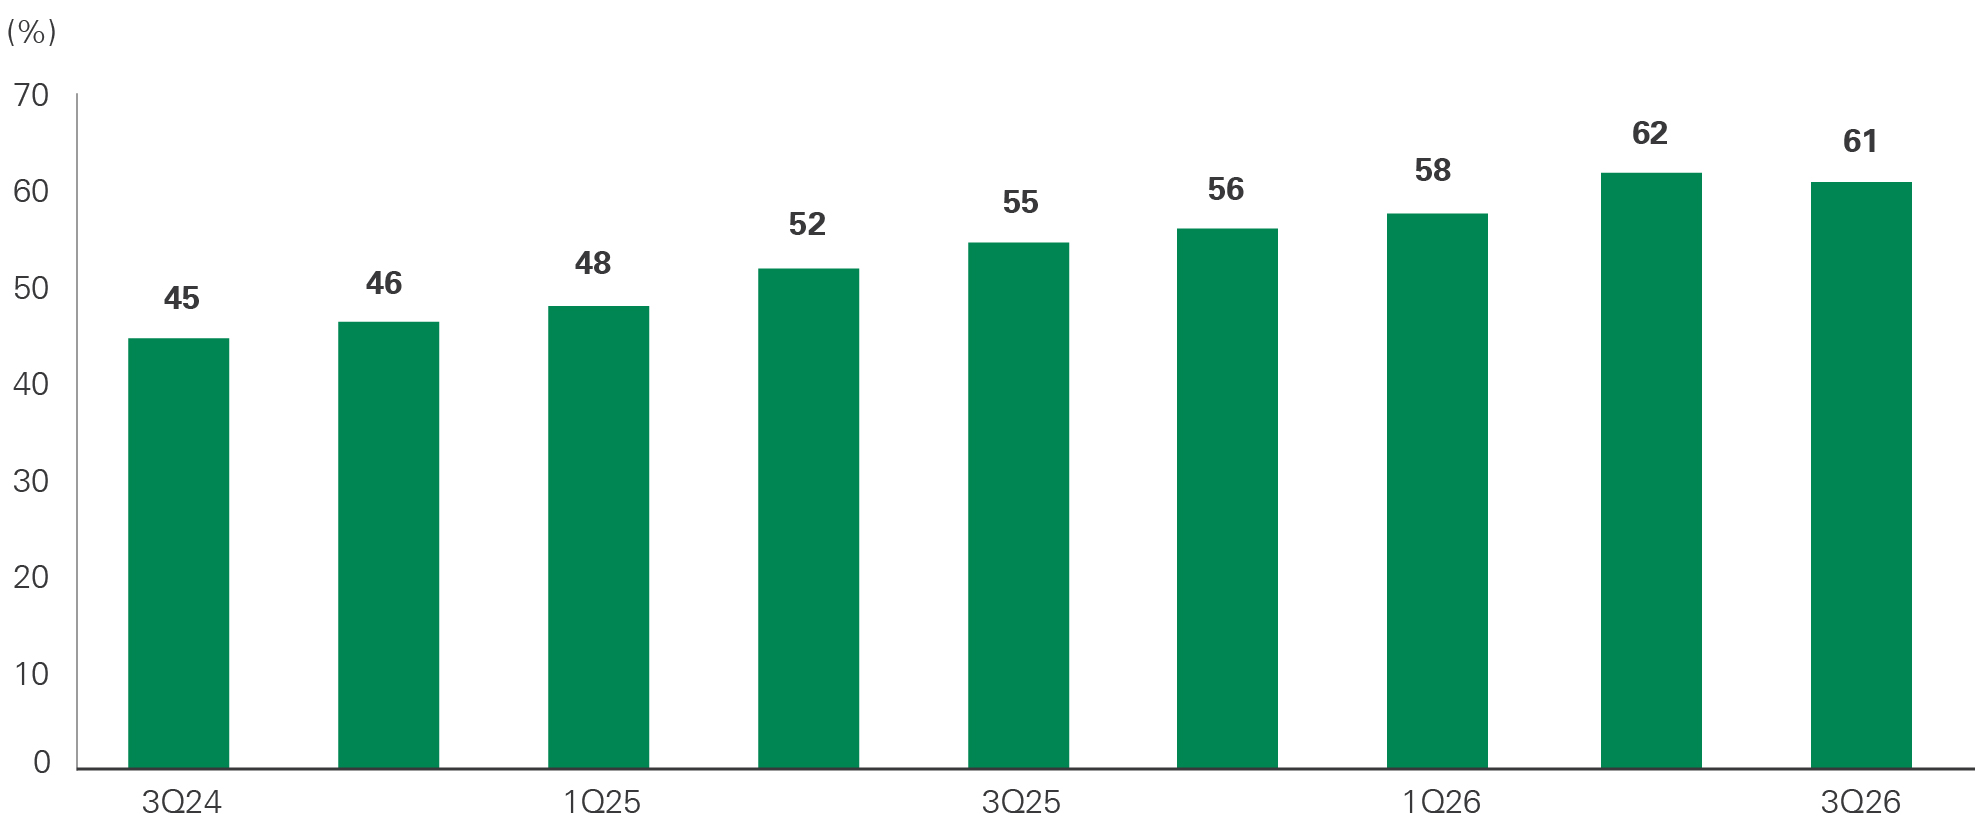
Bar chart showing quarterly percentages from the third quarter of 2024 through the third quarter of 2026. Values are 45% in Q3 2024, 46% in Q4 2024, 48% in Q1 2025, 52% in Q2 2025, 55% in Q3 2025, 56% in Q4 2025, 58% in Q1 2026, 62% in Q2 2026, and 61% in Q3 2026. The percentage increases each quarter until reaching its peak in Q2 2026, then declines by 1 percentage point in the final quarter. The overall increase is 16 percentage points.
Compute suppliers are increasingly providing financing and/or backstops to customers. While AI model builders (e.g., OpenAI, Anthropic) and neocloud providers (e.g., CoreWeave) are driving much of the demand for compute, they currently lack IG credit profiles. The cash-rich hyperscalers have an economic interest in supporting their growth and have been providing financing and/or investments. While sustaining demand, this also weakens the signals that would otherwise discipline capacity buildout. For example, Amazon has announced equity investments worth up to $50 billion in OpenAI and up to $25 billion in Anthropic. These investments include a phased component based on certain events occurring. Meanwhile, OpenAI and Anthropic have pledged to purchase compute from Amazon in amounts worth at least $138 billion and $100 billion, respectively, over multiple years. This activity is not limited to the hyperscalers, with chip financing arrangements expected to ultimately exceed data center financing. A very recent example is Broadcom and a consortium of capital providers announcing a $63 billion financing facility for accelerator chips and equipment. Anthropic will lease the hardware and Broadcom provides partial, contingent support up to a maximum potential liability of $43 billion. These types of supply financing agreements are becoming increasingly common. They balance stronger sales and earnings growth against leverage and earnings risk via equity investments.
Portfolio Approach
Credit selection remains paramount.
As the IG bond market has evolved significantly over the past year, we are mindful of the growth in long-duration risk tied to the AI story. We prefer companies whose legacy businesses can support additional debt obligations, rather than those that depend on AI revenue to achieve financial targets.
We continue to monitor the hyperscalers’ quarterly results for evidence of durable AI monetization. In particular, consistent disclosure of AI-specific return on investment — not simply revenue growth — would improve our comfort levels. We are also looking for financial reporting from model builders Anthropic and OpenAI demonstrating that their services are funded primarily by customer revenues rather than support from compute suppliers. Such evidence could point to broader adoption and help alleviate concerns about circular financing.
Despite more attractive pricing on construction and project debt secured by data center assets, or on subordinated obligations such as leases, we believe the risks outweigh the potential returns. Deal terms and conditions are more complex and less tested compared to senior unsecured obligations. The time-worn industry phrase “cheap for a reason” comes to mind given the risk of a tenant walking away from a lease in a few years, or shorter than expected economic life for chips and servers in a given project.
We remain selective on participating in new issues, as we expect credit spreads to remain vulnerable to negative AI sentiment.
The surge in hyperscaler issuance this year led to progressively higher concessions on new issues. For example, in February 2026, Alphabet was able to price a $20 billion issuance with spread concessions ranging between 7 and 13 basis points. This is modestly wider than the 0–5 basis-point range seen on typical IG financings. Yet in August 2026, at the peak of supply surge, Alphabet’s $25 billion deal required a much more generous concession of 25–27 basis points to clear the market.
Sizable issuance is expected through 2028, and we expect elevated new-issue concessions to persist or even increase. As the AI investment buildout slows, less issuance will be required, and markets could unwind the spread penalty on new issues. If this occurs, we could become more involved in hyperscaler debt, as these companies may return to their longer-term historical profile as infrequent borrowers with a bias toward structurally tighter credit spreads.
- Alphabet, Amazon, Meta, Microsoft, Oracle, and SpaceX.
- Excludes SpaceX, for which no consensus cash flow estimates are available.
Past performance is no guarantee of future results. This material is provided for your general information. It does not take into account the particular investment objectives, financial situations, or needs of individual clients and should not be construed as financial or legal advice. This material has been prepared based on information that Bessemer Trust believes to be reliable, but Bessemer makes no representation or warranty with respect to the accuracy or completeness of such information. This material does not include a complete description of any portfolio mentioned herein and is not an offer to sell or a solicitation of an offer to buy any securities. Views expressed and information contained herein are current only as of the date indicated and are subject to change without notice. Forecasts may not be realized. Estimates concerning AI investment, revenues, cash flows, borrowing and adoption are subject to uncertainty, and actual outcomes may differ materially. The mention of a particular security is not intended to represent an investment recommendation. References to securities, issuers and financing transactions illustrate the topics discussed and do not necessarily reflect holdings in any particular client account. Portfolio holdings and positioning may differ among accounts and may change without notice. All investments involve risk, including loss of principal. Fixed-income securities are subject to interest-rate, credit, liquidity and other risks. Bond prices generally decline when interest rates rise and may decline when credit spreads widen. Longer-duration bonds are generally more sensitive to changes in interest rates. Investment-grade ratings and senior repayment priority do not guarantee payment or eliminate the risk of loss. Legal rights, repayment priority and recourse under corporate debt, project financings, leases and guarantees depend on the terms and structure of the particular transaction. Index information is included herein to show the general trend in the securities markets and you cannot invest directly in an index. The Bloomberg U.S. Corporate Index (LUACTRUU) covers U.S. dollar-denominated, investment-grade, fixed-rate taxable corporate bonds. Index weights and risk statistics describe the index, not a Bessemer portfolio. Duration Times Spread (DTS) is a measure of sensitivity to proportional changes in credit spreads, not a comprehensive measure of investment risk. It does not measure sensitivity to changes in benchmark interest rates. The numerical examples are illustrative approximations that assume unchanged spread duration and no changes in other pricing factors; they do not include income, fees or expenses and are not forecasts of investment returns. Company financial data reflect the reporting periods indicated and do not represent investment performance. EBITDA and adjusted EBITDA, where presented, are non-GAAP measures and are not substitutes for net income or operating cash flow determined under GAAP. Financial metrics may not be directly comparable across issuers. Amounts described as commitments, guarantees or maximum potential exposures are not necessarily recognized balance-sheet liabilities, current amounts payable or expected losses. AI adoption surveys use different populations and methodologies and should not be treated as directly comparable measures.